
When I am analysing and writing about the markets I often make comparisons between items, such as current and prior performance, earnings and macro data, as well as between asset classes, indices, sectors and individual stocks.
The reason for doing this is because it’s far easier to make a judgement about what's happening and what might happen next, if we can put market moves into context. By comparing the current price action or other metrics with what’s gone before rather than trying to view it in isolation.
When we make these comparisons, we view one item relative to another.
Relativity is an important concept in the markets, luckily for us, in this context, it doesn't involve questions about gravity and the bending of space and time.
Relative indications
Relative strength, as measured by the RSI 14 indicator is commonly used by traders to gauge how an instrument is behaving relative to its recent trading history. That’s usually 14 periods, although traders will also use shorter and or longer-term time frames, often in combination with each other, to get a more holistic picture of what's happening.
In the chart below of the SOX index, we can see RSI 14 in the lower window.
The green line is the indicator, the orange line is a 5-day moving average of the indicator. The indicator is telling us that the semiconductor index has sold off sharply in recent sessions but is not yet oversold, as it has a reading of 35.00.
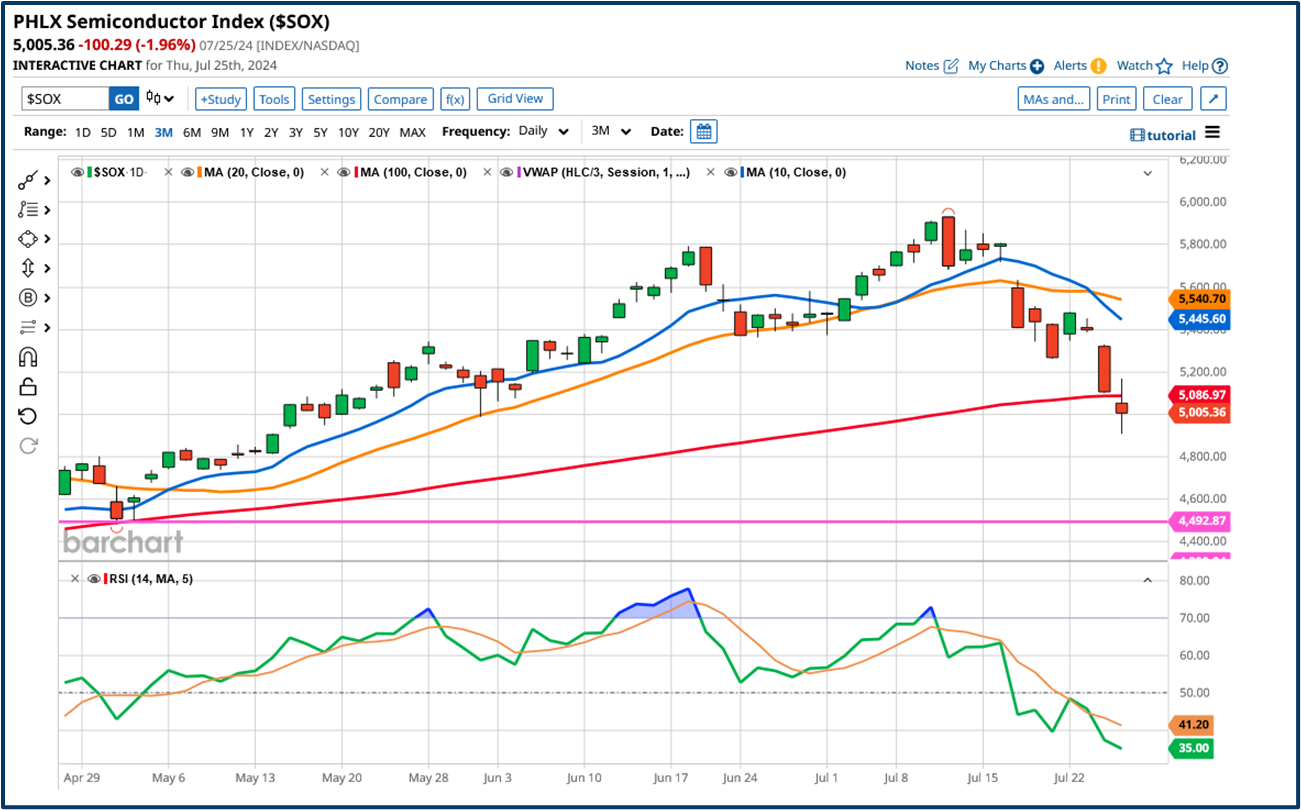
Source: Barchart.com
The RSI 14 indicator tells us how a stock or other instrument is trading within an index or range between lower and upper bounds of 0 and 100.
The indicator comes complete with with overbought and oversold boundaries set at 70.0% and 30.0% respectively.
These levels are not set in stone, and it's quite possible for instruments under observation to over-extend and move through these boundaries and for themto stay there.
However, when instruments are above or below these key levels in RSI 14, we are on alert that a trend change could be in the offing.
I run a daily screen of US stocks looking for just these types of opportunities.
In the table below you can see some of the most oversold stocks under RSI 14 (14D Rel Str) and you can get a feel for their performance from the period % change columns.
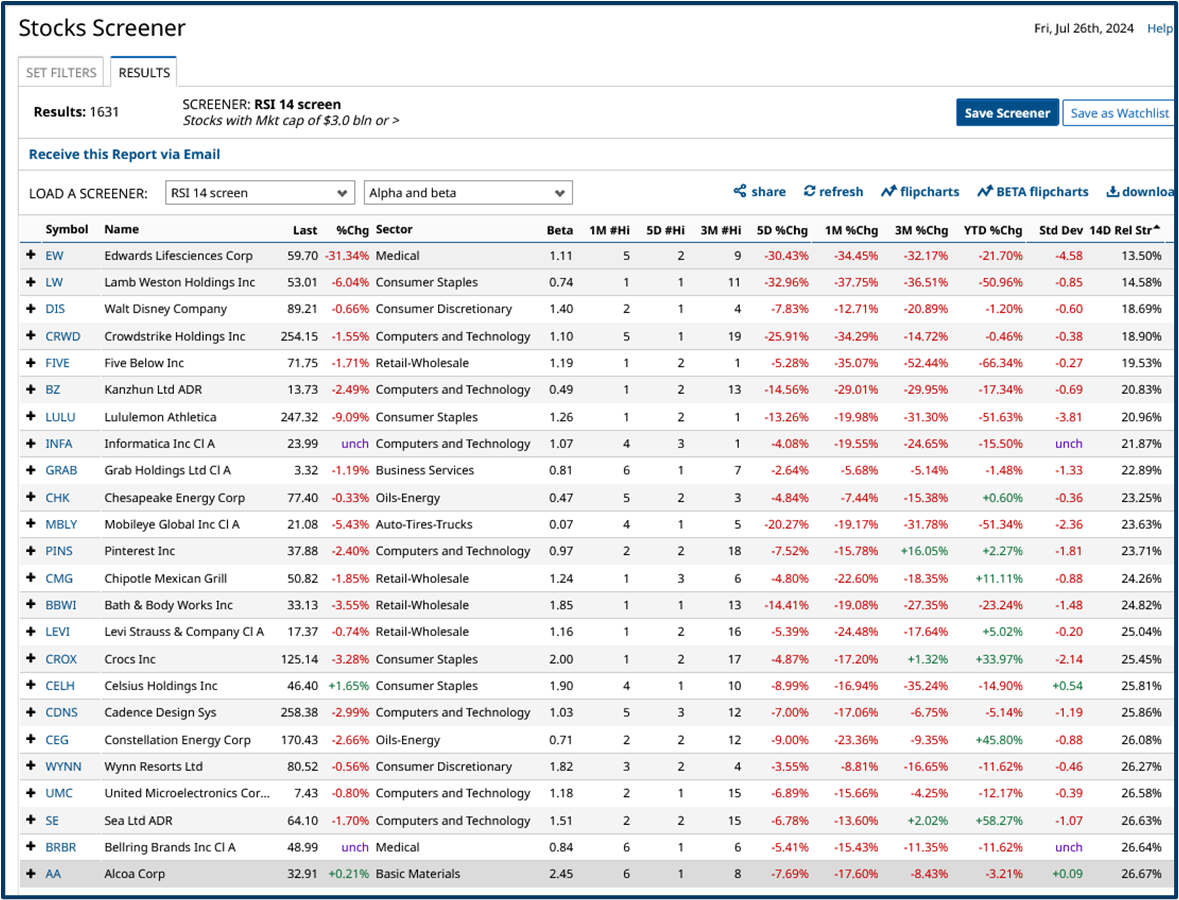
Source: Barchart.com
Here is a selection of US stocks that show up as being overbought under the RSI 14 indicator on July 25th
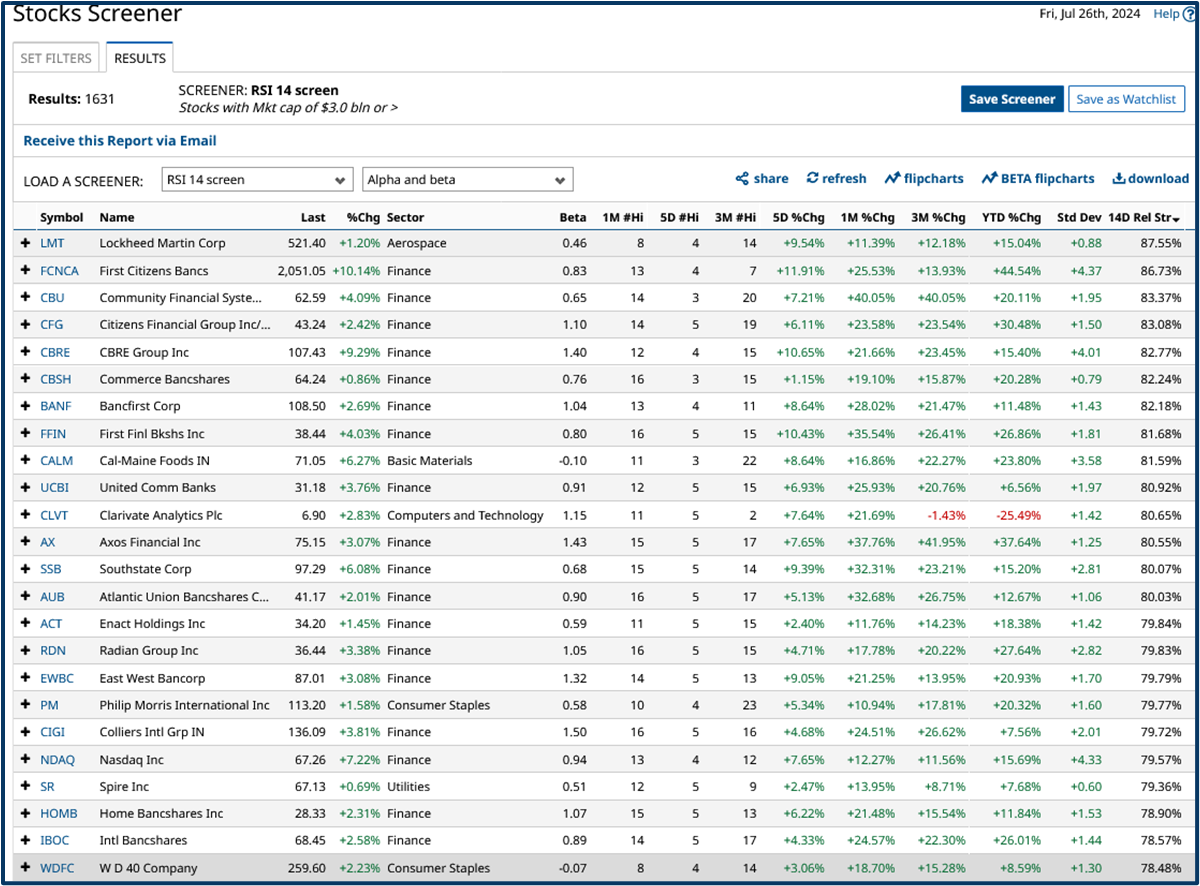
Source: Barchart.com
A contrarian trader might look to sell the overbought names and buy the oversold items.
However, there is no guarantee that the oversold stocks will stop going down, or that the overbought names won't go higher still.
After all, there are reasons why these stocks have experienced such diverse performance.
However, these lists, and others like them are a good starting point for further investigation and inquiry.
A different kind of relative performance
RSI 14 is just one measure of relativity in the markets and there are many others
For example my “Smile charts” are designed to capture or visualise relative strength within the price action. However, rather than comparing a stock’s performance to its own prior performance the “Smile” compares the stock’s price action to that of its peer group.
In the example below we can see the “Price Action Relative Strength” in a universe of just under 200 actively traded US ETFs.
I wrote about some of the ways I use charts like this to identify trading opportunities in the article Exchange Traded Friends
More than anything Smile highlights what’s outperforming the peer group, and what's underperforming them.
And because many of these ETFs are sector-oriented we can get an “at-a-glance” feel for the mood of the market.
The higher to the right the stronger the relative performance, the higher to the left the weaker.
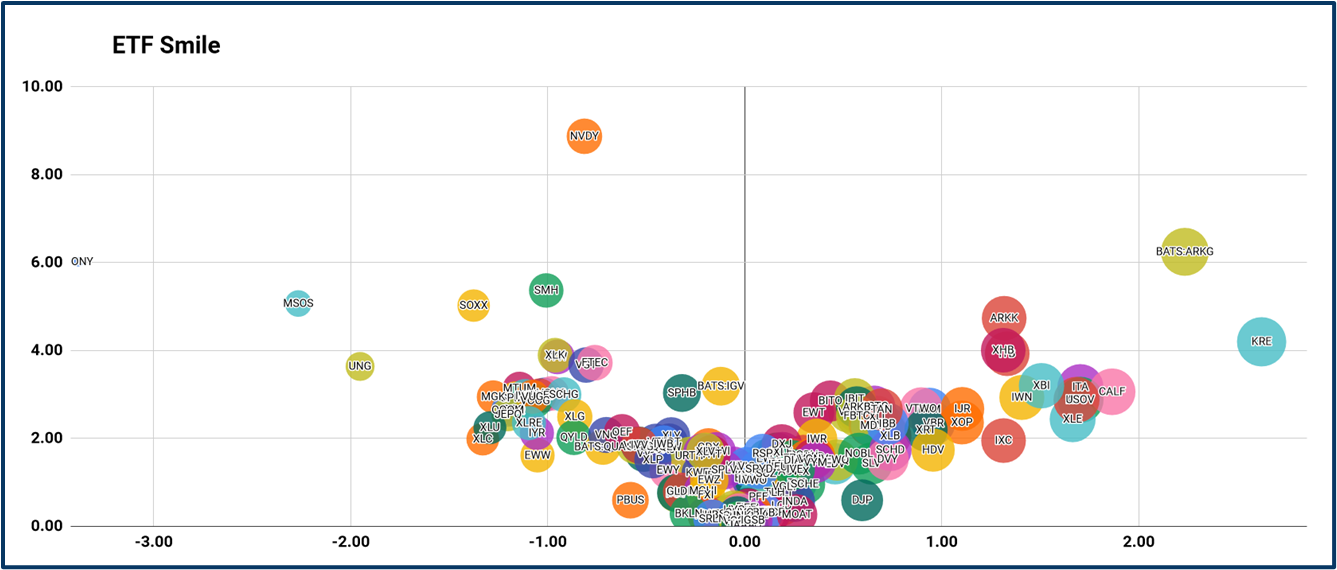
Source: Darren Sinden
Feeling the heat
Heat maps are quite similar to my Smile charts in that they allow for comparisons between instruments.
In the map below we see the S%P 500 stocks ranked by their Price to Sales ratio - which is the market cap of a company divided by its annual revenues.
By using a heat map like this we can quickly see how the market treats different types of stocks.
For example growth companies like Nvidia (NVDA), Microsoft (MSFT) and Visa (V) all have a high price-to-sales ratio.
Whilst defensive names such as Walmart (WMT) Costco (COST) have relatively purpose to sales ratios.
For comparison the S&P 500 Price to Sales ratio comes in at 2.85 times, according to data from Multpl.com.
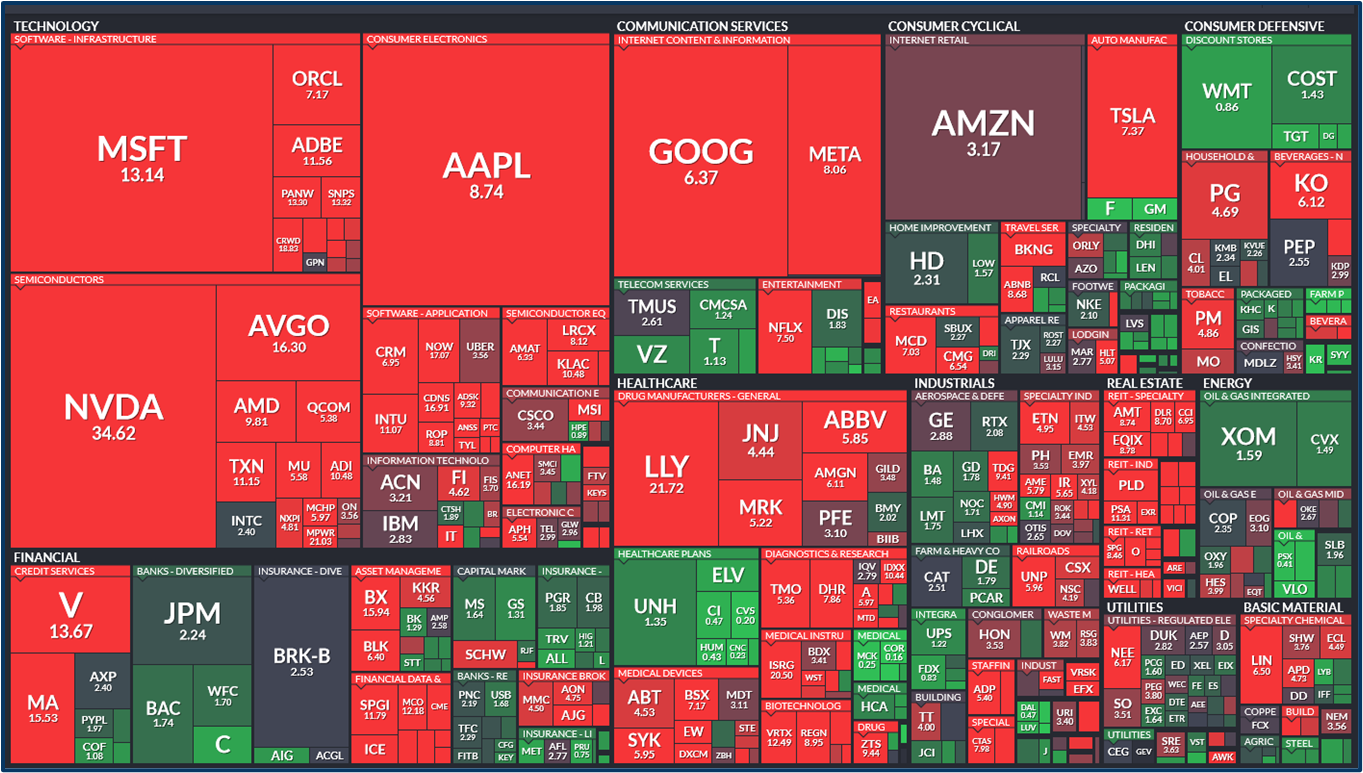
Source: Finviz.com
This next version of the heatmap shows us the one-day price performance of the S&P 500 stocks for July 25th.
At first glance we could conclude that stocks with a high price-to-sales ratio were under pressure on the 25th, though that’s not true in all cases for example Tesla (TSLA) bucked that trend.
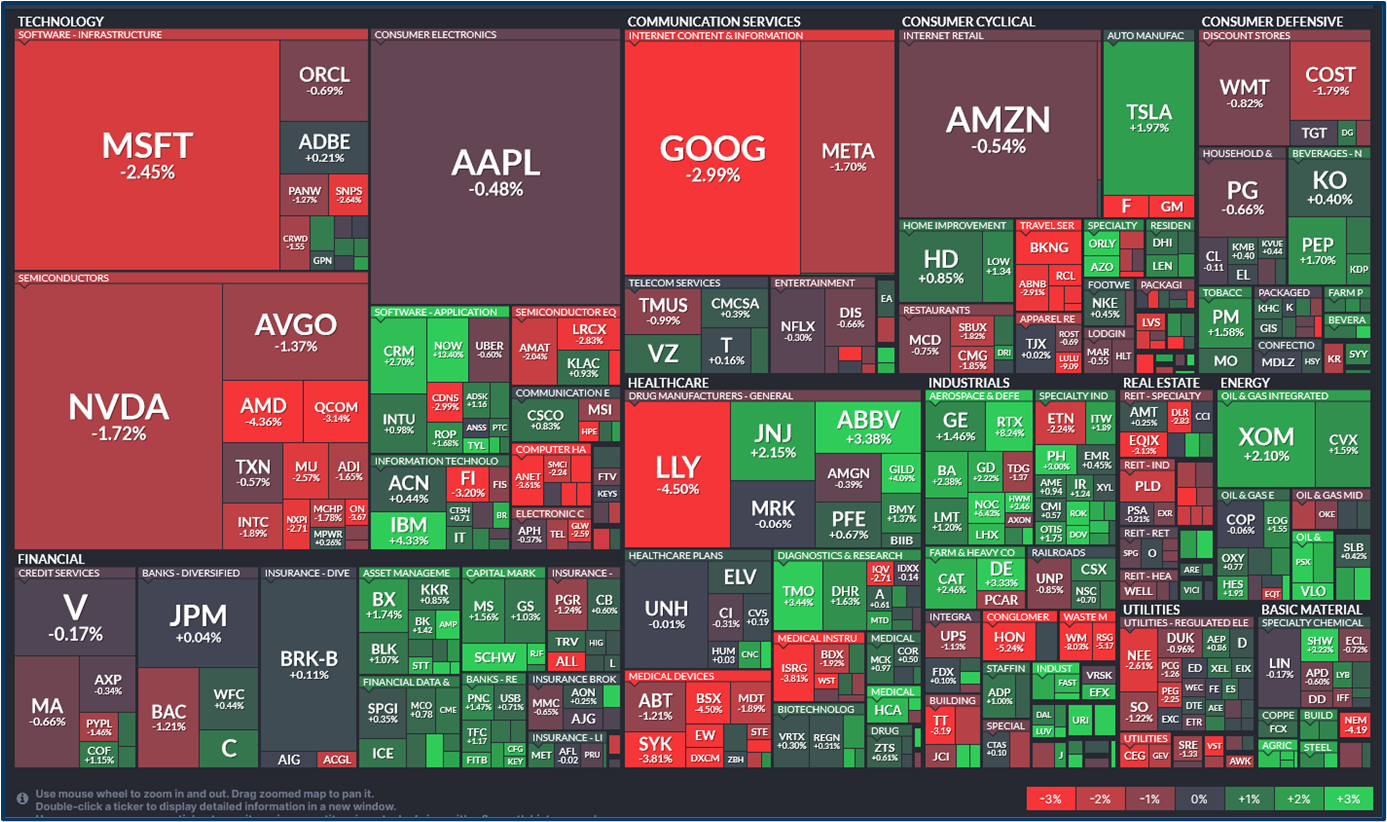
Source: Finviz.com
Making these relative comparisons can provide traders with insights and ideas.
And the more we understand the market dynamics and the relationships between its components, then the better equipped we should be when it comes to picking the right trade at the right time.
All of the tools I used in this analysis are available free of charge.
The information provided does not constitute investment research. The material has not been prepared in accordance with the legal requirements designed to promote the independence of investment research and as such is to be considered to be a marketing communication.
All information has been prepared by ActivTrades (“AT”). The information does not contain a record of AT’s prices, or an offer of or solicitation for a transaction in any financial instrument. No representation or warranty is given as to the accuracy or completeness of this information.
Any material provided does not have regard to the specific investment objective and financial situation of any person who may receive it. Past performance is not a reliable indicator of future performance. AT provides an execution-only service. Consequently, any person acting on the information provided does so at their own risk.