
This might seem like a strange question and a strange title for an article about trading the markets, let me explain how it came about.
I have written extensively about how to spot trading opportunities using indicators and signals from the price action. The success or failure of which, will often depend on momentum, at least in its broadest sense.
Trade ideas gather momentum as more and more people wake up to the opportunity and do something about it.
You can have the best idea in the world but if nobody else in the market buys into it, then an idea is all it’s likely to remain.
When I was a broker, selling ideas to hedge funds, there was nothing more frustrating than spotting an opportunity, hitting the phones to highlight it to my customers, and getting no response other than a polite thanks for the call. It didn’t happen often, but it did happen.
Of course, there was some satisfaction in seeing the idea come to fruition but no commission.
“What is most important isn’t knowing the future — it is knowing how to react appropriately to the information available at each point in time.”
Ray Dalio CIO Bridgewater Associates
We often won’t know what the catalysts, that turn an opportunity/idea into a valid and profitable trade, are beforehand.
However, if 40 years in the markets has taught me anything, it’s that “if you build it they will come “
which means that if you pick the right trade setup then it’s very likely to play out - because that’s the just way the markets work.
There are thousands of other traders out there looking for opportunities every day.
if the setup is in a well followed, liquid stock, with good average volumes, it will be on other people’s radar too. And if the idea is formulated properly, then sooner or later it’s going to get traction and play out.
Of course, in equity markets over the last few years momentum has largely been in one direction, and that has been upward.
S&P 500 area chart
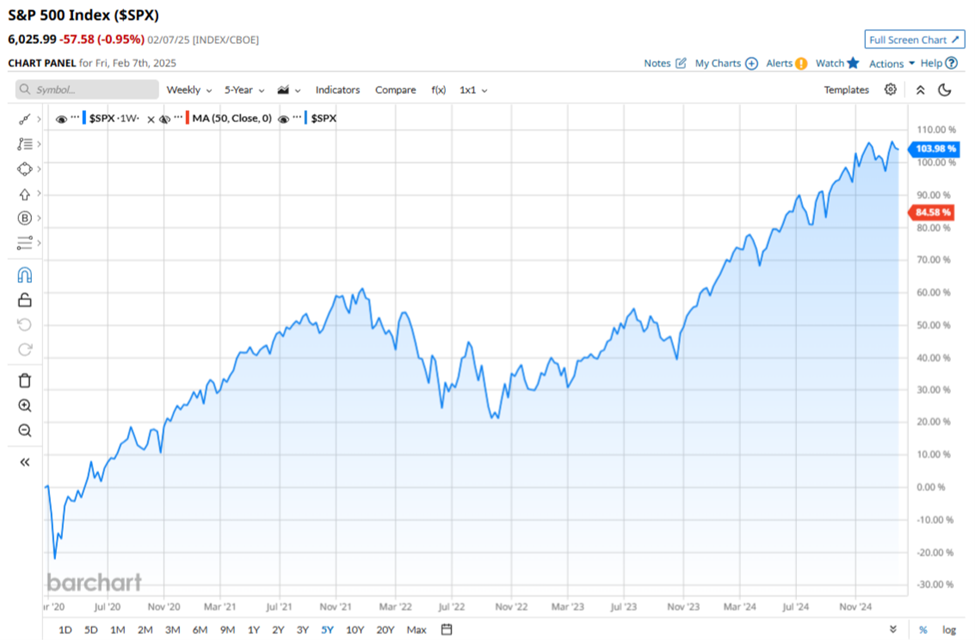
Source:Barchart.com
Given that monodirectional momentum, the question must be - Have I become a one trick pony? Only able to spot opportunities in a bull market? And, what’s more, have all of us fallen into that trap?
I would very much like to think not
Rather I think the truth is, that short side opportunities have been far less frequent, and potentially far less rewarding, in a market that has seen the S&P 500 rally by +78.0% in five years.
What has happened instead is that we have learned to play the cards that we have been dealt, we have been pragmatic and gone with the flow, and the Path of Least Resistance
That phrase is so important in trading, because it explains why opposing established trends isn’t usually a good idea. Why trends end, and reverse.
And why trade opportunities and set ups suddenly spring to life, as new information emerges.
Here is a real-world example of that very thing, in the shape of UK oil major BP BP.LN which has been under pressure of late and underperforming many of its sector peers.
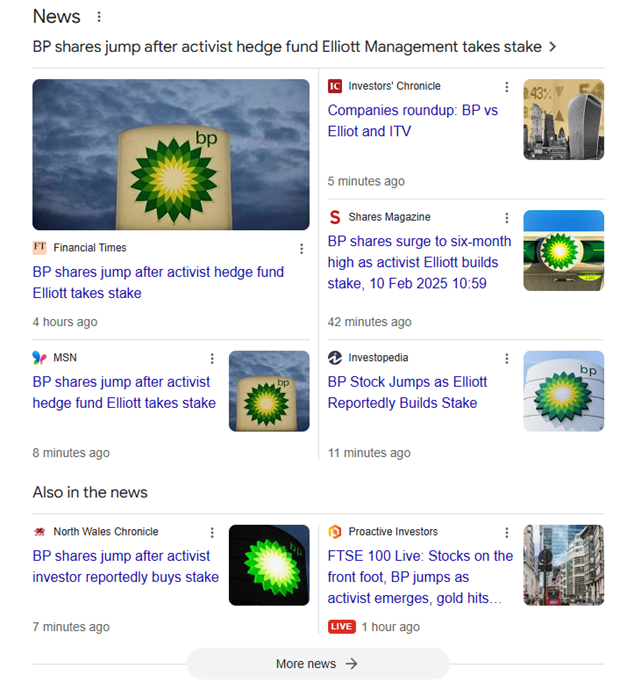
Source:Google news
In the chart below I have highlighted the initial momentum signal, which was posted back on January 3rd and then over the weekend, news broke that US activist investor Elliot Management was building a stake in the company.
BP BP.LN chart
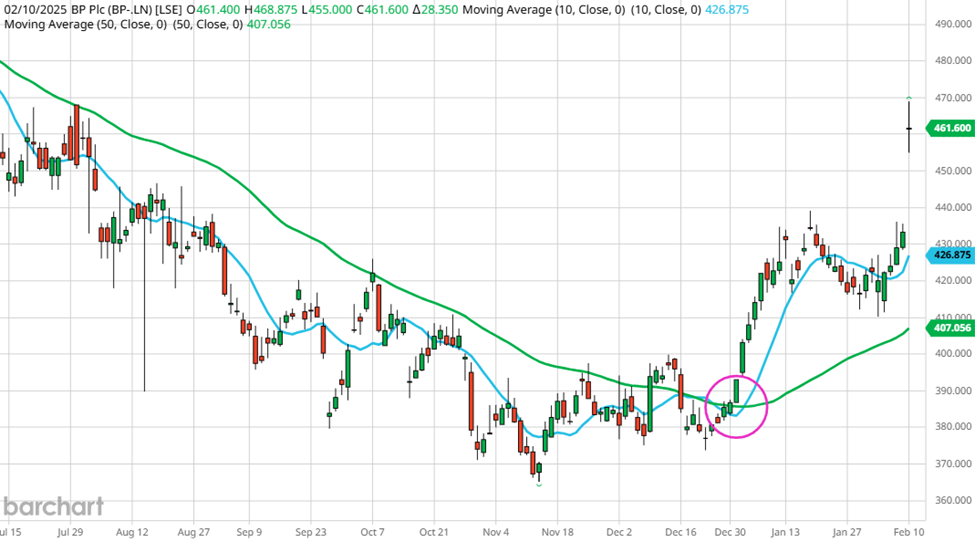
Source:Barchart.com
BP gapped up by more than +32p on that news and traded another +7p higher printing at 468.87p in Monday’s session, before drifting back to trade around 461p up +6.20% on the day.
Monday also produced another highly topical example of how an idea or opportunity can pan-out over time, with new information acting as a catalyst for change.
Another Example
Here are two charts for US steel producer Nucor NUE US, a stock that’s been on my radar since June 2023.
In the first chart we see Monday 10th of February’s price action, on a 6-month chart. The stock traded up to and just above $140.00, on news of the imposition of +25.0% tariffs on steel imports coming into the US.
Nucor NU US Chart 6-month daily chart
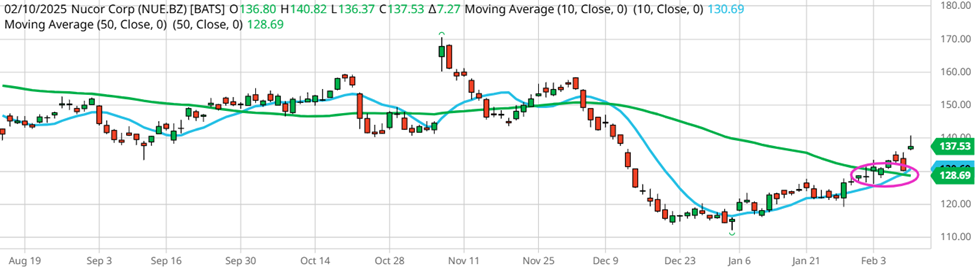
Source:Barchart.com
The second shorter term chart shows an upside momentum signal in Nucor from late January over an hourly time frame, just below $125.00, and just the sort of signal to put on alert in this stock/sector.
Nucor NU US 1-month hourly chart
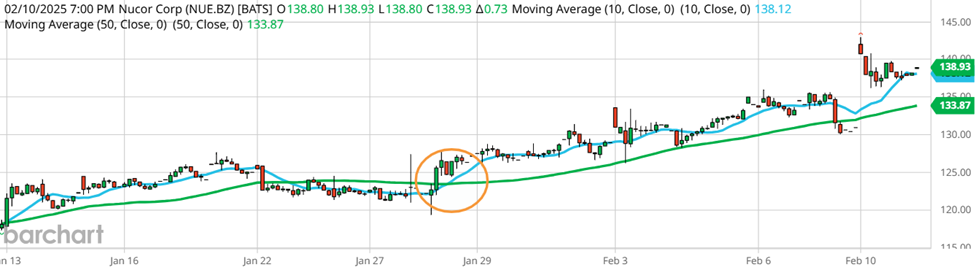
Source:Barchart.com
In the next article in this series, we will look at the history of momentum and how it can be combined effectively, with other trading and investing styles, to surface potential trade setups and more.
The information provided does not constitute investment research. The material has not been prepared in accordance with the legal requirements designed to promote the independence of investment research and as such is to be considered to be a marketing communication.
All information has been prepared by ActivTrades (“AT”). The information does not contain a record of AT’s prices, or an offer of or solicitation for a transaction in any financial instrument. No representation or warranty is given as to the accuracy or completeness of this information.
Any material provided does not have regard to the specific investment objective and financial situation of any person who may receive it. Past performance is not a reliable indicator of future performance. AT provides an execution-only service. Consequently, any person acting on the information provided does so at their own risk.