
Whether you are a beginner or an experienced trader, you are probably always looking for new trading tools to add to your trading strategy. How about Fibonacci retracements? This article will give you a solid understanding of how Fibonacci retracements work and how you can use them to improve your trading. Let’s dive right in!
Who is Fibonacci?
Fibonacci, also known as Leonardo of Pisa or Leonardo Pisano, was an Italian mathematician in the 12th century. He is best known for his Fibonacci sequence, which is a series of numbers where each number is the sum of the two preceding numbers (e.g., 0, 1, 1, 2, 3, 5, 8, 13, 21, 34, etc.).
In the trading world, Fibonacci is best known for his work on the "golden ratio", a mathematical ratio believed to be found in many natural phenomena, including the stock market. The golden ratio is approximately equal to 1.618. This number, along with its inverse (0.618) and several other related ratios, is used to construct Fibonacci retracements, a popular tool used in technical analysis of financial markets.
Fibonacci's work has been widely adopted in the trading world, especially for its ability to identify potential support and resistance levels in the market. Although Fibonacci is not a trader himself, his work in mathematics has had a significant impact on the way traders and investors analyse the markets, as we're about to see.
What are Fibonacci retracements?
Fibonacci retracements are a technical analysis tool that uses horizontal lines to indicate areas where a financial instrument's price may experience support or resistance.
These levels are determined by calculating the Fibonacci ratio of the price movement between a high and a low point. The most commonly used Fibonacci retracement levels are 23.6%, 38.2%, 50%, 61.8%, and 100%.
Traders will often use these levels in combination with other forms of technical analysis to determine entry and exit points for trades.
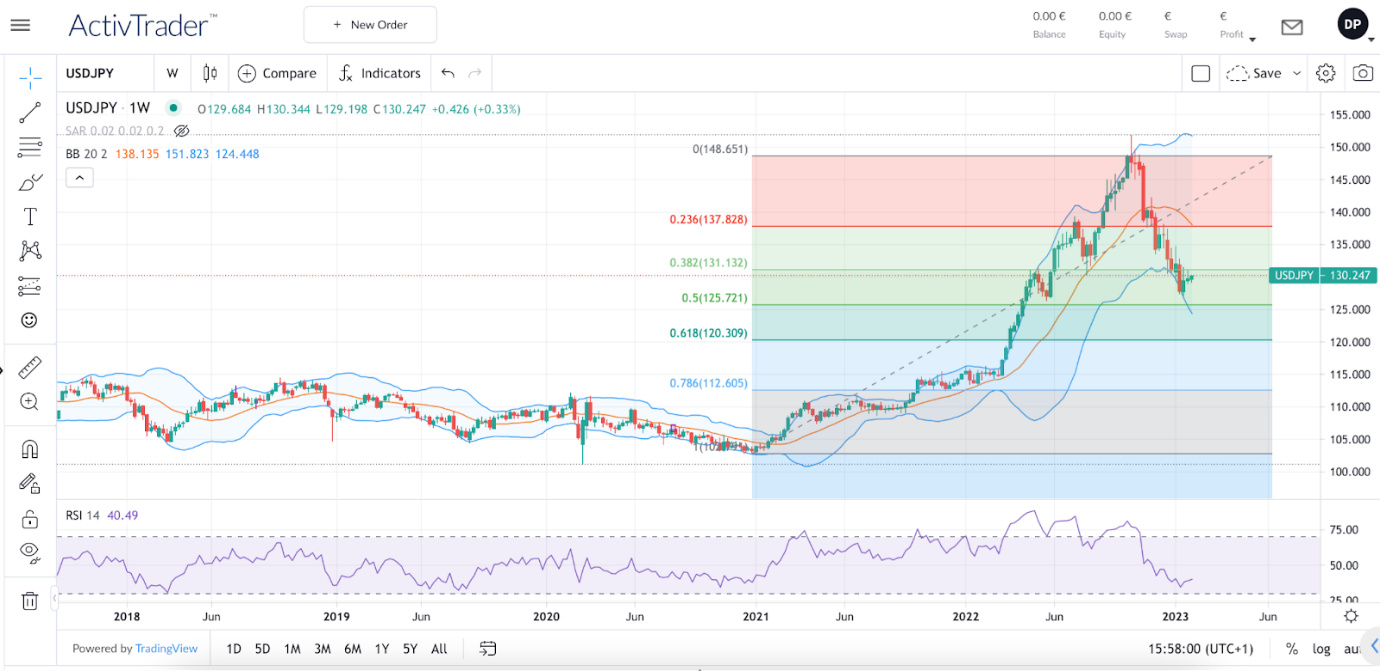
Weekly USD/JPY Chart - Source : ActivTrades’ online trading platform
What are the benefits and limitations of using Fibonacci retracements in your strategy?
Fibonacci retracements have several advantages as a technical analysis tool
- Predictive value: Fibonacci levels are often used by technical traders to predict support and resistance levels. This can be particularly useful when combined with other technical indicators such as trend lines or moving averages, or as a way to place stop-loss and take-profit orders.
- Popularity: Fibonacci retracements are widely used by traders and investors, so they can serve as a way to identify potential trades in line with market sentiment.
- Flexibility: Fibonacci retracements can be applied to any financial instrument, including stocks, currencies, commodities, Forex, cryptocurrencies and more.
- Simple to use: The tool is easy to use, and can be applied to charts with just a few clicks, allowing traders to quickly identify key levels and open or close positions accordingly.
- Easy to understand: Fibonacci retracements are based on simple mathematical ratios that are easy for most traders to understand and that can be easily applied to any chart.
- Great tool for medium to long term investors: This trading tool is very useful for investors who are looking for significant price movements to take advantage of and for investors who make decisions based on the trend.
However, this tool also have several limitations
- Outdated data: They are based on historical data, so some traders believe they can't predict future price movements.
- Accuracy: Fibonacci retracements are not always accurate and the price may not always match the levels predicted by the retracements, which could lead to incorrect or incomplete analysis and trading decisions.
- Interpretation: As with most trading tools, they are subject to interpretation and different traders may have different views on key levels, which can lead to confusion.
- Absence of other factors taken into account: They do not take into account other important market factors such as economic and political events.
- Unpredictability of price movements: They are based on the assumption that markets have a natural tendency to retrace a predictable part of a move, but markets can be irrational and price movements can be driven by a variety of factors that cannot be predicted or explained by technical analysis.
- Not suitable for short-term traders: They are not suitable for short-term traders, as the nature of the tool is more useful for medium to long-term traders.
How to draw Fibonacci retracements
To correctly draw Fibonacci retracements, you will need to follow a few steps.
First, you need to identify the high and low points on the chart that you want to analyse. These points are used to calculate the Fibonacci levels.
Then, you need to select the Fibonacci retracement tool from your broker's trading platform. You can then click on the low point and drag the tool to the high point (if the main trend is bullish but prices may be about to reverse) or click on the high point and drag the tool to the low point (if the main trend is bearish but prices may be about to reverse).
This will automatically generate the Fibonacci levels on your chart, most commonly 23.6%, 38.2%, 50%, 61.8% and 100%. These levels are displayed as horizontal lines on the chart so that you can see where prices might react.
Finally, you can interpret the levels and identify potential areas of support and resistance, as traders often look for price to stall or reverse at these levels, and open trades accordingly.
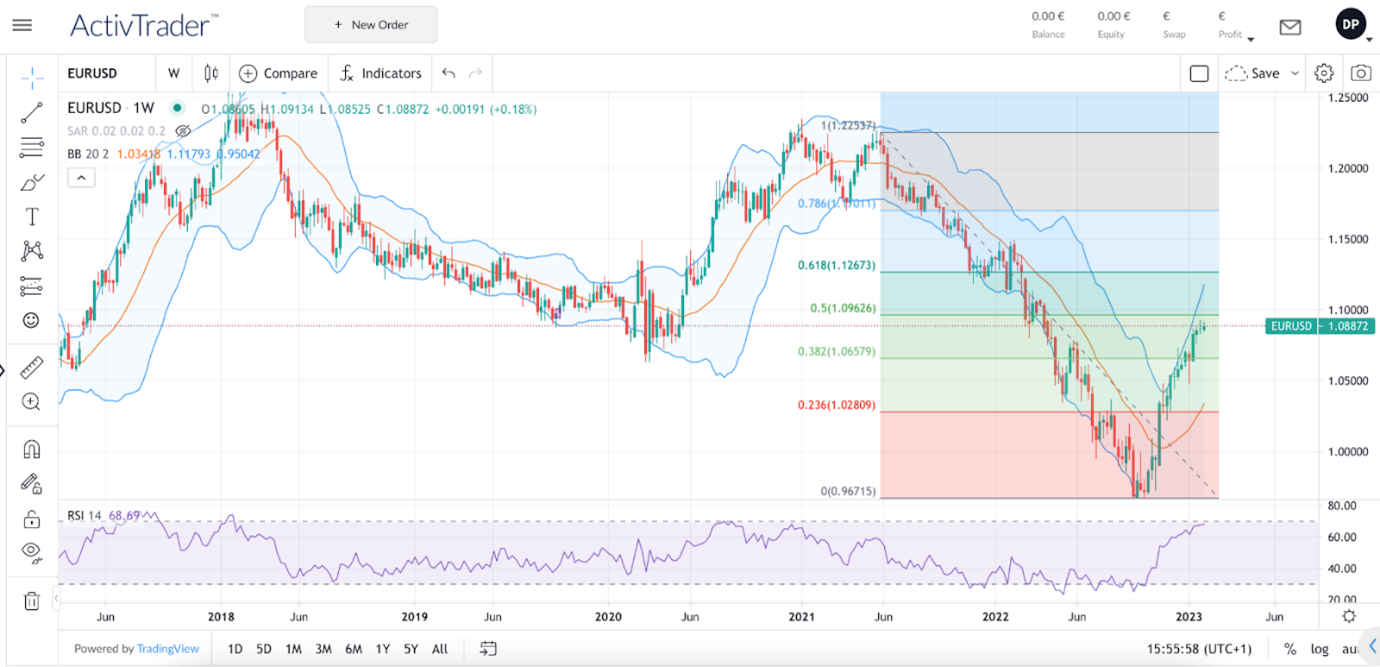
Weekly EUR/USD chart - Source: ActivTrades
Fibonacci retracements, supports, and resistances
Support levels are levels at which the price of an asset tends to find buying interest, meaning that the price is likely to stop falling or bounce higher. Support levels are often seen as the 'floor' of the market for a particular asset, and traders will often look for the price to stall or reverse at these levels.
Resistance levels are the opposite of support levels. They are levels at which the price of an asset tends to find selling interest, meaning that the price is likely to stop rising or fall back. Resistance levels are often seen as the 'ceiling' of the market for a particular asset. Traders will often look for the price to stall or reverse at these levels.
Fibonacci retracements can be used to identify potential support and resistance levels by measuring the size of a price move and then applying the Fibonacci ratios to that move. When the price retraces to these levels, traders often interpret them as potential support or resistance levels.
How to use Fibonacci Retracement in your trading strategy
Fibonacci retracements can be used in a trading strategy in a number of ways.
As explained above, one of the most common ways to use Fibonacci retracements is to identify potential support and resistance levels. When the price retraces to a Fibonacci level, traders will often interpret it as a potential level of support or resistance and open or close trading positions depending on their scenario and strategy.
Traders can also use Fibonacci retracements to set stop-loss and profit-taking orders to better protect their positions. It is therefore a great money and risk management tool to use. Remember that a stop-loss is an automatic trading order that closes your losing positions at a predetermined level to limit your losses. On the other hand, a take profit order is an automatic order to close your winning positions once they've reached an agreed level.
Finally, traders can also use Fibonacci retracements to determine the direction of the market. A retracement to the 38.2% level during an uptrend may indicate a short-term correction, while a retracement to the 61.8% level during a downtrend may indicate a potential reversal. It is therefore a great tool for trend traders or those willing to bet against the trend.
It's important to note that you should use Fibonacci retracements in conjunction with other technical analysis tools and methods to get a more complete view of the market. You should also always consider the context of the market and the underlying fundamentals of the instrument you are analysing.
The information provided does not constitute investment research. The material has not been prepared in accordance with the legal requirements designed to promote the independence of investment research and as such is to be considered to be a marketing communication.
All information has been prepared by ActivTrades (“AT”). The information does not contain a record of AT’s prices, or an offer of or solicitation for a transaction in any financial instrument. No representation or warranty is given as to the accuracy or completeness of this information.
Any material provided does not have regard to the specific investment objective and financial situation of any person who may receive it. Past performance is not a reliable indicator of future performance. AT provides an execution-only service. Consequently, any person acting on the information provided does so at their own risk.