
Quiet periods in the market are the ideal time to do some research, after all if trade ideas and opportunities aren’t leaping out of the screen at you, why not go and do some digging of your own?
We shouldn’t feel the need to trade for the sake of it, and sometimes the hardest, but ultimately the most profitable thing to do, is to do nothing.
However, combing the market for opportunities and trade setups can be a good use of a trader's time because, if nothing else, they become more familiar with the instruments they trade.
On the beat
Market reporters and journalists talk about having a “beat”, that is the area of markets or the specific subjects they cover, it’s their patch.
And the same thing applies to traders: the instruments you trade and the timescales you trade them over, comprise your beat.
Of course, it's possible to have more than one beat, but I would be very surprised if you did not favour one grouping more than the others.
Often as not my trading beat is the S&P 500. I can't pretend to know every single one of the stocks in the index intimately, and even now I come across stocks that I have never heard of, or looked at before.
However, the idea that I might discover something new and, or exciting, is one of the reasons why I like this stock universe so much.
It's also one of the reasons why I take a contrarian approach in my analysis from time to time.
Stocks that are rallying tend to get more headlines and column inches than those that are falling, or have fallen out of favour.
If you believe, as I do, that markets are cyclical, that is they move in cycles. Then the idea of reversion to the mean will probably appeal to you.
Averaging out
Mean reversion is simply the idea that stocks and other securities enjoy periods of outperformance and periods underperformance, but that, ultimately, they revert back towards a long term average or price trend.
With that in mind I thought I would screen the S&P 500 for stocks that are oversold and then look to see if any of these names have the potential to bounce.
Oversold
One measure of overbought and oversold conditions is the RSI or Relative Strength Indicator, which measures current price action against historic price action, to create a measurement of an instrument's relative performance.
The results of which are expressed as a value, within an index that ranges from 0 to 100%.
The indicator has overbought and oversold boundaries which are set at 70.0% and 30.0% respectively.
If a stock's RSI 14 reading passes through these boundaries it doesn't mean that the price can’t rise further, or fall lower. However, it does tell us that the price action in that stock is at odds with the historic trend.
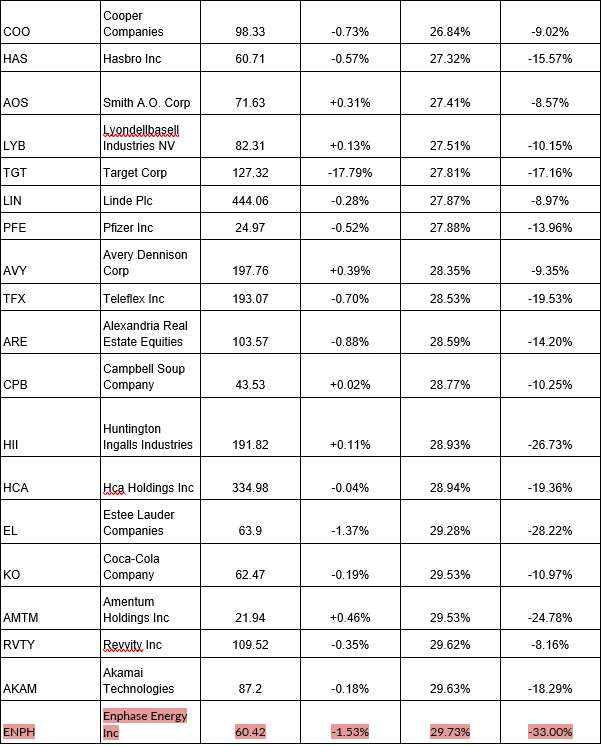
To find a list of oversold S&P 500 stocks a good place to start would be with those stocks that have an RSI 14 of 30.0% or less.
The table below contains 47 stocks that met that criteria on Wednesday afternoon, they are ranked lowest to highest by RSI 14 readings.
We can also see the percentage change on the day and the 1-month percentage change for each of the stocks, which gives us some context.
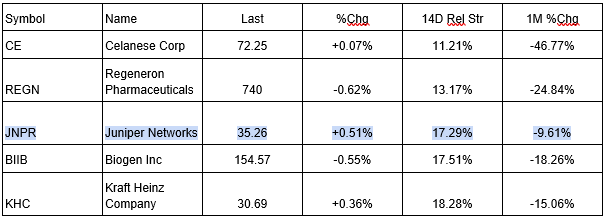
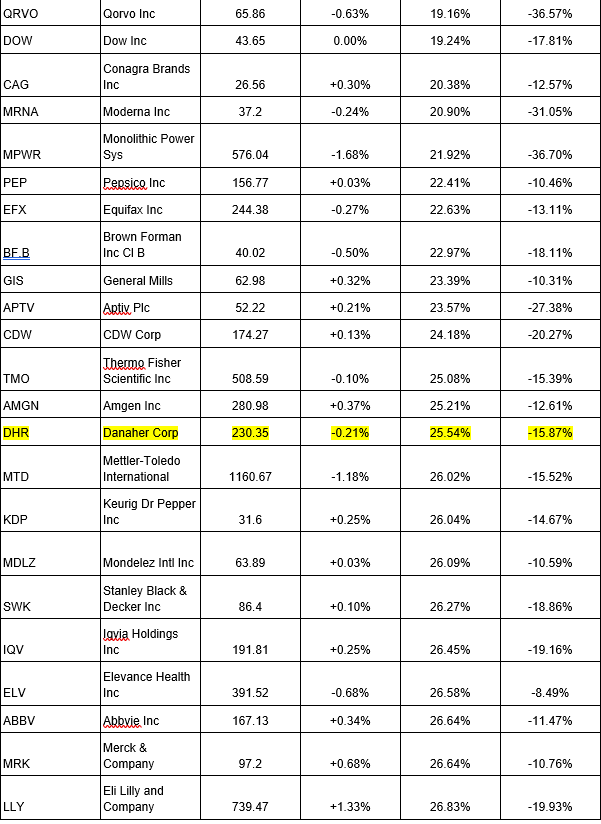
Source: Barchart.com/ Darren Sinden
Examples
I have selected a few charts of stocks on the list, to try and illustrate the sort of things I look for in this type of analysis.
Let's start with Enphase Energy ENPH, which has the highest RSI 14 reading in the list, but which has fallen by -33.0% over the last month.
Enphase is a solar energy and energy storage business, which makes and sells products to homeowners and landlords.
Solar power has been under a cloud since September and underwent another downward leg post the US election, because it was not clear that the incoming Trump administration would treat the sector favourably.
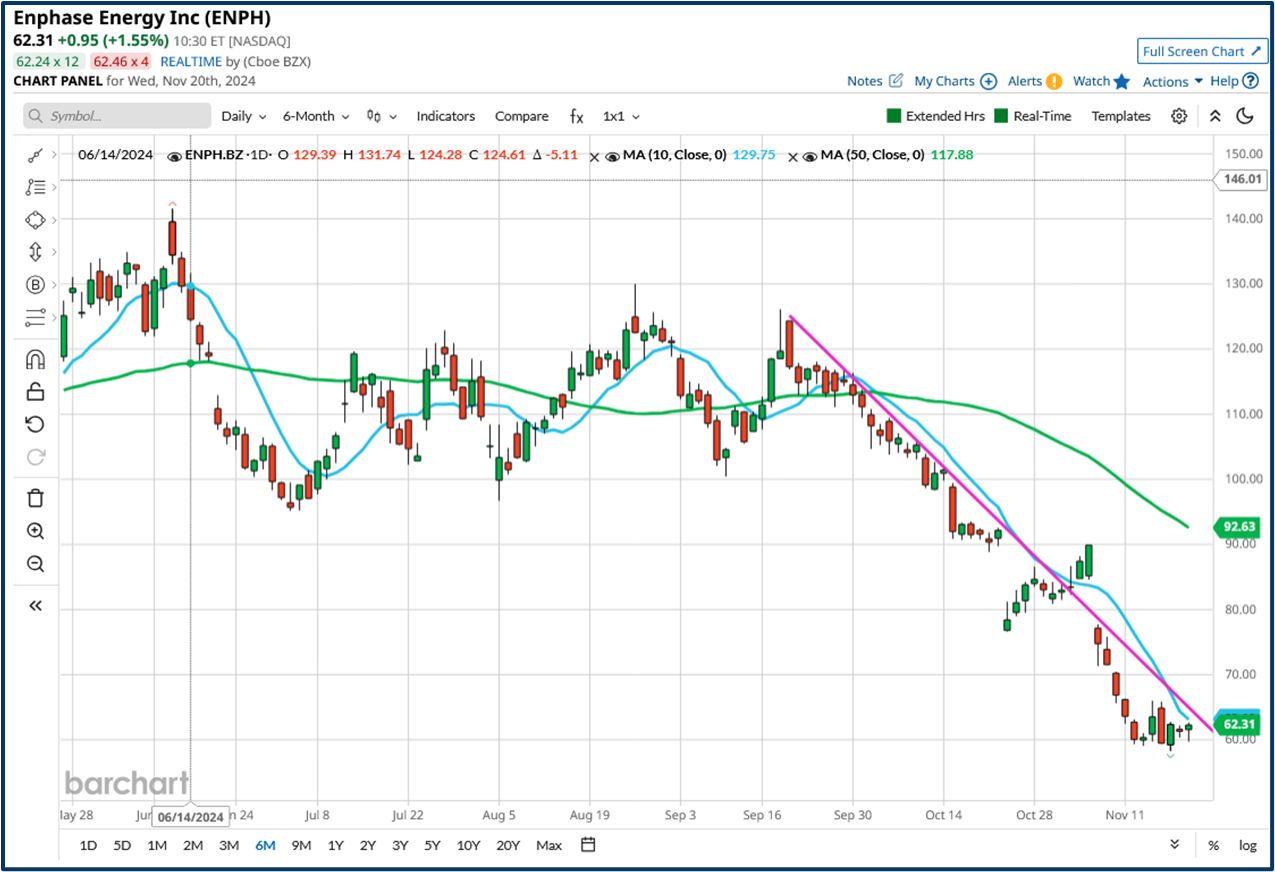
Source: Barchart.com
In fact Enphase Energy finished +3.29% higher on Wednesday, testing above the 10 day MA line in the process.
A move above the moving average, and the downtrend line, could see the stock price head back through $70.00, and of course the post election gap at $84.64 also catches the eye.
None of this is cast in stone but it’s certainly worth being aware of.
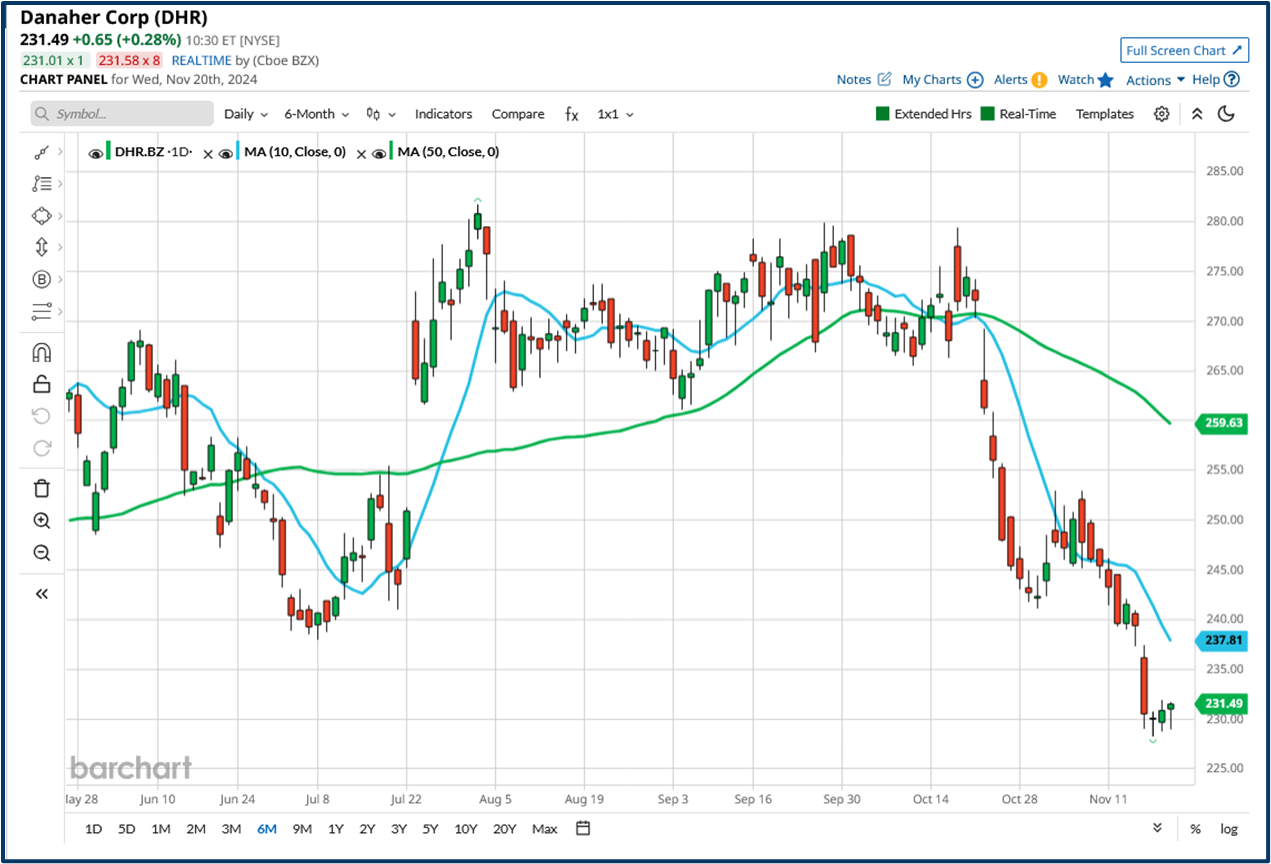
Our second chart contains Danaher DHR, which makes testing equipment and machinery for the Life Sciences sector.
The stock has underperformed the wider market by almost -16.80% over the last month, it has an RSI 14 reading of 25.54% and has fallen by almost -16.0%, since mid October.
However, it had previously demonstrated impressive upside momentum, posting 27 highs year-to-date, and 35 over the last 12-months.
Danaher was trading at $281.00 as recently as August 1st.
The price looks to have found support at and around $230.00 and at the time this chart was drawn, a Hammer was forming in the daily chart. The Hammer formation is said to be beating out a bottom in the price. However, that pattern can only be confirmed at the close.
From a chart standpoint we can see a clear downtrend line drawn from mid September. The downside move was closely tracked by the 10-day Moving Average.
Interestingly the stock seems to have found support around $60.00 and has now started to test higher.
Source: Barchart.com
In fact Enphase Energy finished +3.29% higher on Wednesday, testing above the 10 day MA line in the process.
A move above the moving average, and the downtrend line, could see the stock price head back through $70.00, and of course the post election gap at $84.64 also catches the eye.
None of this is cast in stone but it’s certainly worth being aware of.
Our second chart contains Danaher DHR, which makes testing equipment and machinery for the Life Sciences sector.
The stock has underperformed the wider market by almost -16.80% over the last month, it has an RSI 14 reading of 25.54% and has fallen by almost -16.0%, since mid October.
However, it had previously demonstrated impressive upside momentum, posting 27 highs year-to-date, and 35 over the last 12-months.
Danaher was trading at $281.00 as recently as August 1st.
The price looks to have found support at and around $230.00 and at the time this chart was drawn, a Hammer was forming in the daily chart. The Hammer formation is said to be beating out a bottom in the price. However, that pattern can only be confirmed at the close.
In the end we didn't get a Hammer in the Danaher chart ,but we did get a bold green candle that suggests that the buyers were in charge in Wednesday’s session.
That's not a strong enough signal on its own, and we would need to see confirmation and continuation of bullish price action, before we could think about a meaningful move higher.
So it's one to watch.
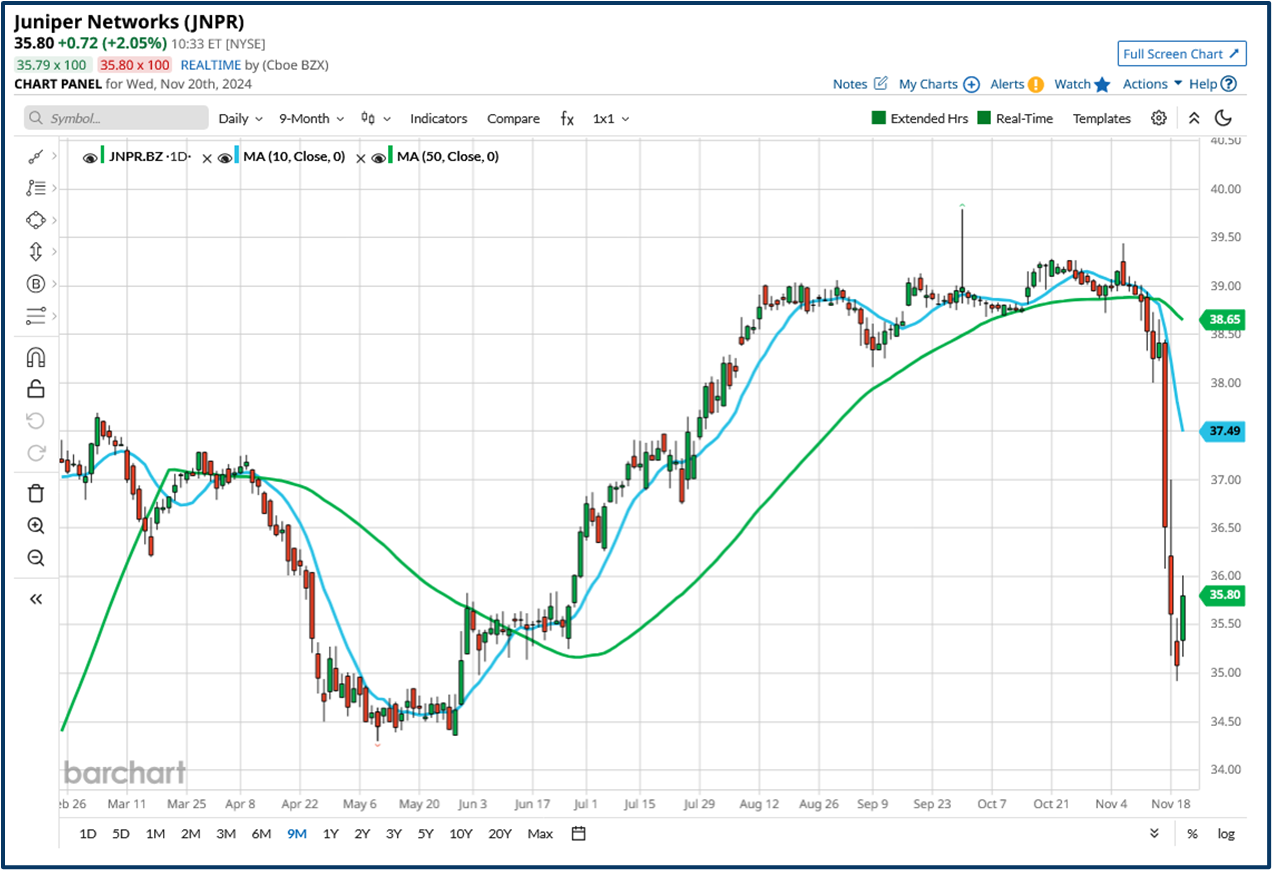
I am not so sure about our third example, Juniper networks, despite its low RSI reading and more than -9.0% one month fall. Because the upside from the current levels looks limited by resistance around $39.00.
Source: Barchart.com
And though this exercise is about price action, rather than newsflow, we need to be pragmatic, and recognise that the US Department of Justices’ interest in the proposed merger between Juniper and HPE, on possible antitrust grounds, is a significant roadblock.
.
Though it's tempting to think that the Trump administration might have different views on competition policy and M&A.
However, I think the dust needs to settle here, and we could do with a period of consolidation on the chart, such as that seen in May, before the price action can undergo a reset.
There are plenty more charts to look at in the list of stocks above and of course this list is a moveable feast because RSI 14 readings are subject to change.
And we could enhance the list by adding in an RSI over a different period of say 5 days or even 20. Or we could try and track the proximity of current stock prices to key moving averages and the changes there in.
I am sure you will have your own ideas about how you can use and improve the data, and that’s good because getting you thinking about this is really the point of this exercise.
The information provided does not constitute investment research. The material has not been prepared in accordance with the legal requirements designed to promote the independence of investment research and as such is to be considered to be a marketing communication.
All information has been prepared by ActivTrades (“AT”). The information does not contain a record of AT’s prices, or an offer of or solicitation for a transaction in any financial instrument. No representation or warranty is given as to the accuracy or completeness of this information.
Any material provided does not have regard to the specific investment objective and financial situation of any person who may receive it. Past performance is not a reliable indicator of future performance. AT provides an execution-only service. Consequently, any person acting on the information provided does so at their own risk.