TradingView is a leading tool for charting and performing detailed analysis on a wide range of markets, including stocks, cryptocurrencies, and commodities. However, it boasts many features, some of which are uncommon, so learning how to use TradingView can be challenging.
Throughout this TradingView guide, we'll break down the platform in its entirety, discussing technical indicators, analytical capabilities, scripting support, and value for money. Let's get started.
TradingView Basics
The TradingView platform boasts a varied selection of features designed to cater to a large number of traders. Regardless of whether somebody is a long-term investor or a day trader focusing on hourly charts, TradingView has useful features, like:
Charting on TradingView
Its charting capabilities are a key contributor to TradingView's popularity. The platform lets people swap between 21 chart types, including candles, lines, and bars. Moreover, TradingView boasts many drag-and-drop lines, ranging from basic trend lines to more complex Fibonacci retractments.
Users can draw directly on a TradingView chart and have the ability to save and return to their analysis at a later date, which is ideal for plotting complex multi-day strategies. Additionally, users can control the chart's colour scheme and set up web/email alerts for when an asset's price crosses a trend line.
Technical Indicators
TradingView's vast selection of technical indicators compliments its charting tools well. The platform offers standard technicals like the Relative Strength Index (RSI) and more obscure options like Rob Booker's Knoxville Divergence. Multiple indicators can be applied to a chart.
TradingView even offers an auto chart pattern system that drastically reduces the technical element of identifying patterns. Some of the best Tradingview indicators for versatility include Bollinger Bands, Moving Averages, Volume Weighted Moving Averages (VWAP), and the Stochastic Oscillator.
Markets Supported on TradingView
As TradingView caters to traders and investors universally, it supports all major markets across various geographies, including stocks, indices, crypto, forex, bonds, and Exchange-Traded Funds (ETFs).
TradingView Heatmaps
A heatmap helps people visualise the performance of an entire market in a single image. The shade of the heatmap represents the intensity of a move; the darker, the stronger the move. Negative growth is red, and positive is green. TradingView has heatmaps for the stock, crypto, forex, and ETF markets.
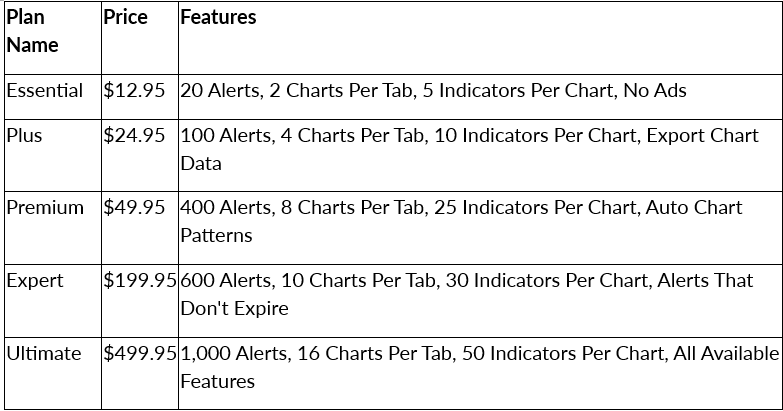
TradingView Cost
People can use TradingView for free as much as they want, albeit with a few restrictions surrounding alerts, auto chart patterns, and the number of indicators one can apply to a chart. Our TradingView guide also covers its five premium plans:
TradingView Scripts
TradingView designed and integrated the cloud-based Pine Script programming language, which enables advanced users to create custom indicators and strategies that run on TradingView's servers and leverage the platform's data.
How to Set Up TradingView
Setting up TradingView might seem daunting, but the process is quick and straightforward. Anyone can register for a free TradingView account, so the platform is widely accessible.
1. Register For an Account
The first step in our TradingView tutorial is creating an account. People can sign up for an account via Google, Facebook, X.com, Yahoo, Apple, LinkedIn, or email. If choosing the latter, users must provide an email and password. After confirming a registration email, the account will be ready to use.
2. Choose a Plan
After creating a TradingView account, users must decide on which plan to use. We've provided a table comparing the plans in the above section. While a free plan will suit beginners, people who actively trade or track multiple assets/markets may benefit from a paid plan.
3. Connect to a Broker
Although it's not a requirement, people can link their TradingView and broker accounts, enabling them to open and close positions without leaving the platform. People can connect TradingView to ActivTrades and other platforms.
4. Download TradingView
TradingView Desktop is a downloadable software version of the charting platform. It offers all the features of the cloud platform with the bonus of native multi-monitor support and synchronised crosshairs to make performing analysis simpler. It's available on multiple devices:
- TradingView Windows App - Requires Windows 10 or 11
- TradingView for Macbook - Requires macOS Catalina version 10.15 or higher
- TradingView for Linux - Requires Ubuntu or Debian
A TradingView app download is also available for Android or iOS mobile devices. It offers many of the features available on the desktop/online platforms, along with the convenience of having a full suite of charting tools in your pocket.
How to Use Trading View
Use your TradingView login details to access the platform. Then, you can use all of its tools and features. Anyone seeking a TradingView tutorial should master these basic steps:
Search for an Instrument
From the TradingView home page, enter the name of an asset into the search bar. Traders can narrow down the results by filtering via the market. For example, stocks, forex, or bonds. After doing so, check the chart provider to ensure accurate prices, hover over an asset, and press 'Launch chart'.
Compare Assets
TradingView includes a helpful function for quickly comparing two or more assets. Pressing the '+' icon located at the top of the screen next to the symbol name will bring up a search menu; from there, choose an asset and select a comparison method to display multiple charts.
Alter Chart Settings
People can alter what data TradingView displays. Next to the '+' symbol, people can change which timeframe the chart is set to, ranging from 1 tick to 12 months. Scrolling on the chart or the price scale will let you zoom in/out, making it easier to view small movements and perform detailed analysis.
Charting Tools and Technical Indicators
TradingView comes equipped with many charting tools and technical indicators. Drawing tools are available on the left-hand side menu, while indicators are found at the top of the screen, close to the timeframe selection menu.
How to Use TradingView with ActivTrades
The next step of our TradingView tutorial is linking the charting platform with a broker. ActivTrades is a leading trading platform and a TradingView Platinum Broker, which highlights its status. To use an ActivTrades account with TradingView:
Connect ActivTrades to TradingView
First, create an ActivTrades account, then verify and fund it. On a TradingView chart, click the 'Trading Panel' button at the bottom of the screen. Select ActivTrades, click 'Connect', and log in. TradingView and ActivTrades will link your accounts automatically.
Trade on TradingView
After linking the accounts, click the 'trade' button to open the order menu. From here, users can buy/sell assets and set up take profit/stop loss orders that are near-instantly executed on ActivTrades without having to switch platforms.
TradingView Demo Account
Traders can sharpen their trading skills without risk by using a demo account. First, open an account on ActivTrades by selecting the 'Open Demo Account' option under the 'Accounts' tab.
After opening a demo account, swap between live/demo accounts on TradingView by selecting 'Demo' from the 'Account' drop-down located just below the chart.
TradingView Tips & Tricks
Our TradingView guide has covered the main aspects of the platform, so now we can share a few extra tips and tricks:
TradingView Backtesting
People can manually backtest strategies on TradingView to see how they might perform in the future. However, the platform also offers a 'Strategy Tester' feature, which will automatically test strategies and provide statistics on their effectiveness.
Custom Themes
Charting is a highly visual process. To enhance visibility, TradingView lets people set custom colours for candles, lines, and the background. A dark mode is also available to reduce eye strain.
FAQs
Is TradingView Safe?
TradingView is the most popular charting and analysis platform. It works with leading brokers and securely stores user information. TradingView is secure and offers tools like Two-Factor Authentication (2FA) to help people stay safe.
Is TradingView Free?
TradingView offers multiple subscriptions, including an entirely free tier. While anyone can access the web platform or the TradingView download, professional traders will benefit from auto chart patterns, the additional alerts, and the higher indicator limits that a paid plan offers.
Which TradingView Pricing Tier Is Best?
There is no single best tier for everybody. The right TradingView plan will vary based on your needs, experience level, and budget. A free plan will suit many people, while a Plus or Premium plan vastly enhances the platform's capabilities without being as expensive as a professional plan.
The information provided does not constitute investment research. The material has not been prepared in accordance with the legal requirements designed to promote the independence of investment research and as such is to be considered to be a marketing communication.
All information has been prepared by ActivTrades (“AT”). The information does not contain a record of AT’s prices, or an offer of or solicitation for a transaction in any financial instrument. No representation or warranty is given as to the accuracy or completeness of this information.
Any material provided does not have regard to the specific investment objective and financial situation of any person who may receive it. Past performance is not a reliable indicator of future performance. AT provides an execution-only service. Consequently, any person acting on the information provided does so at their own risk.