
Let's explore the world of triangle trading, enabling you to gain comprehensive insights into the art of identifying these patterns and optimizing their use in your trading endeavors.
What are triangles in trading?
In the realm of technical analysis, triangles play a pivotal role for traders as they offer valuable insights into prospective price shifts, whether to confirm an existing trend after a pause or initiate a price reversal when market sentiment has shifted. However, triangles are typically viewed as confirmation patterns.
These patterns come about as price movements gradually narrow between lower highs and higher lows, encapsulating a visual representation of the ongoing struggle between bullish and bearish forces, where trader action loses momentum and volatility slows down.
The price of the asset must touch each trendline at least twice to confirm the pattern's validity, but traders usually look for at least five touches of support and resistance lines.
In essence, triangles manifest as chart patterns defined by converging trendlines, taking on a triangular form, and they signify a period of relative equilibrium, as neither buyers nor sellers have gained the upper hand, marking the calm before a substantial market movement known as the breakout.
A breakout is easy to spot, as it occurs when prices break out of a triangle in one direction by moving above a resistance or below a support. Typically, an upside breakout signals a robust, impending bullish price movement, while a downside breakout indicates a robust bearish price movement in the making.
The time it takes for a triangle to form can vary widely depending on the timeframes you're using, on the asset you're trading and on the overall market movements. Triangles can develop over short periods, such as a few weeks, or extend for several months, depending on the asset's price action and market conditions.
What are the three types of triangles?
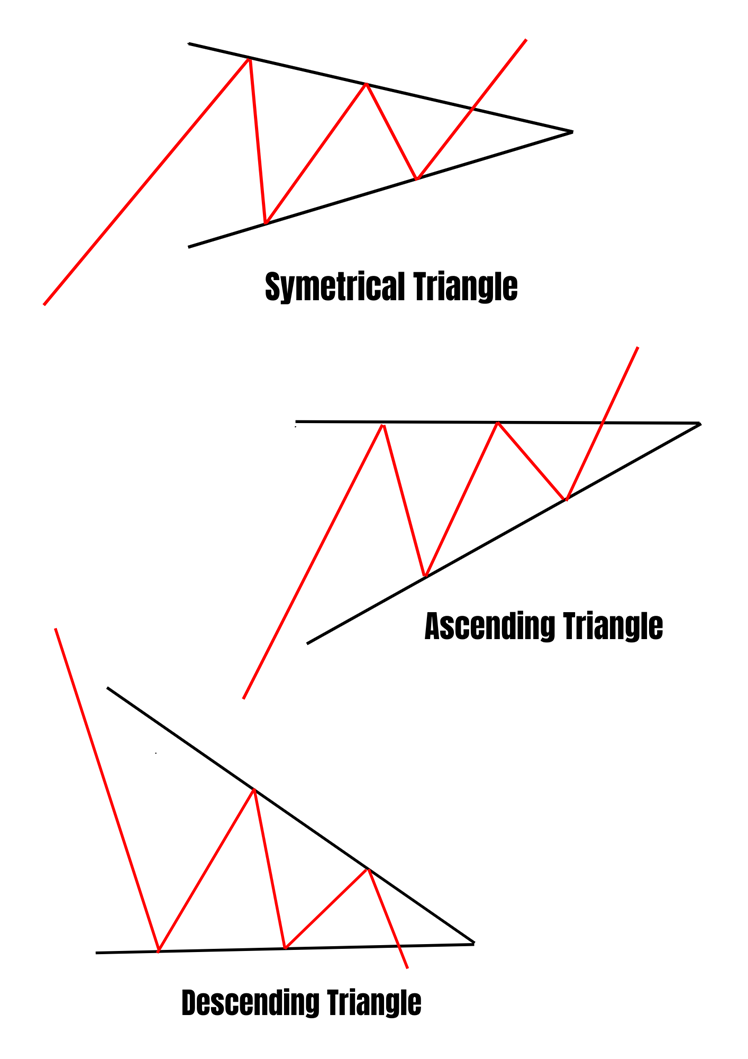
1. Symmetrical triangle
2. Ascending triangle
3. Descending triangle
Understanding the different triangles
Ascending triangles
An ascending triangle typically takes shape when the lower trendline is on the rise, and the upper trendline serves as a barrier that buyers struggle to surpass, which is called a resistance. This type of triangle usually appears on bullish markets.
With ascending triangles, the previous price movement often indicates a prevailing bullish sentiment that frequently leads to an upward breakout. However, there are instances when the resistance level proves insurmountable, resulting in a downward breakout.
As prices break out of the ascending triangle with an upward move, the resistance (represented by the upper trendline, often likened to a ceiling) transforms into a robust support level. This support can serve as a foundation for price retracements during pullbacks.
Descending triangles
A descending triangle usually forms when the upper trendline is descending, while the lower trendline acts as a barrier that sellers find challenging to breach, often referred to as support. This pattern is commonly observed in bearish markets.
In the case of descending triangles, the prior price action often reflects a dominant bearish sentiment, which frequently culminates in a downward breakout. Of course, you can find instances of where the support level is so strong that prices will not go through, and instead bounce off it and exit the triangle through an upward movement.
When prices exit the descending triangle through a downward movement, the support (represented by the lower trendline, often compared to a floor) takes on the role of a substantial resistance level. This resistance can act as a barrier for price retracements during pullbacks.
Symmetrical triangles
The symmetrical triangle takes shape when the price fluctuates within two converging trendlines, producing lower highs and higher lows. In this pattern, neither line exhibits a distinct slope, signifying a state of equilibrium where neither buyers nor sellers are driving the price significantly in a specific direction.
This usually indicates a phase of uncertainty on the markets, highlighting a balance of power between buyers and sellers and foreshadowing an imminent breakout in either direction, depending on which side takes over.
Triangle Trading Strategies
Breakout Trading
The prevailing strategy for trading triangle patterns primarily involves patience, as traders await a breakout in price movement. Upon the breakout, they strategically enter trades in the direction aligning with market momentum, aiming to capture the acceleration in price.
Due to variations in the drawing of trendlines and diverse trading approaches among traders, the precise entry points may differ. Often, traders take volume into account to further refine the timing of their entry.
Typically, when an upside breakout occurs, traders open buy or long positions to seize the upward potential, whereas for a downside breakout, they initiate short-selling or short positions to capitalize on the expected downward trajectory.
Pullback Trading
Pullback trading within triangle patterns revolves around the recognition of entry opportunities during retracements within the pattern. But the most popular strategy is about seizing a momentary reversal in price movement that frequently follows a breakout.
Following a breakout, it is customary to witness a pullback, constituting a minor retracement or correction phase. During this period, the price retraces a portion of the distance it covered during the breakout.
Traders frequently capitalize on these pullbacks by entering positions in alignment with the breakout's direction to profit from the new trend or the new movement within a primary trend if they've missed the breakout, or if they seek to augment their existing positions.
In the context of an upside breakout, the pullback corresponds to a temporary price decline, while in the case of a downside breakout, it entails a brief price upswing.
Trading in Anticipation
Trading in anticipation before the breakout is a proactive and risk-prone strategy favored by experienced traders that are looking to open trades in advance of the actual breakout event.
To implement this technique, traders establish a directional bias rooted in the preceding trend that led to the formation of the triangle. In cases where the prior trend exhibited a bullish trajectory, traders anticipate an upside breakout. Conversely, when the prior trend was bearish, they prepare for a downside breakout.
However, the primary risk inherent in this strategy is the possibility of miscalculating the breakout's direction. Careful analysis and risk management are imperative when engaging in such anticipation-based trading.
Technical Analysis and Triangle Patterns
Technical analysis tools and indicators play a crucial role in better understanding triangle patterns and better spotting breakouts.
Candlestick patterns, for instance, provide insights into potential price movements and into market sentiment, which helps in forecasting breakout directions.
A bullish candlestick pattern, such as a hammer, double bottom, or bullish engulfing pattern, observed within a triangle, can signify robust buying interest, potentially hinting at an impending upward breakout.
Conversely, bearish candlestick patterns like a shooting star, double top, or bearish harami within triangle formations may indicate diminishing bullish sentiment and the potential for a downside breakout.
Furthermore, the identification of pivotal support and resistance levels within triangles empowers traders to pinpoint areas where buying and selling interest converge. In addition, traders can harness the predictive power of technical indicators to discern potential breakouts and shifts in momentum.
Bollinger Bands, for instance, are adept at signaling periods of decreased volatility and extreme price levels. The Relative Strength Index (RSI) offers valuable insights into conditions of overbought or oversold, potentially highlighting forthcoming corrections. Meanwhile, the Moving Average Convergence Divergence (MACD) becomes a reliable ally in assessing strengthening upward or downward momentum, with its signal line crossovers and histogram bars providing key indicators.
Risk Management when Trading Triangles
Because there are a lot of false breakouts with triangles, you need to implement effective risk management to be sure you're protecting your trading capital, minimizing your losses, and achieving potential sustainable long-term success in trading.
These setups include implementing stop-loss and take-profit levels, as well as wisely sizing positions and taking into account some specific considerations when trading triangles.
● Set Stop Loss and Take Profit Levels
○ A stop-loss order serves to limit your potential losses in the event the market moves adversely and reaches a predetermined price point that represents the maximum amount of money you're ready to lose.
○ Conversely, a take-profit order is employed to secure profits when the market moves in your favor and reaches a specific price level at which you're happy to close your positions.
○ While your stop-loss and take-profit orders should always be based on your risk appetite, trading experience and financial objectives (the risk/reward ratio you accept while trading), you can also use the price dynamics within the triangle and technical analysis to help you.
○ When there is a bearish breakout and price breaches the lower part of the triangle, consider placing a stop-loss order slightly beyond a recent swing high.
○ In the event of a bullish breakout, you could position a stop-loss order slightly below a recent swing low.
○ To place take-profit orders, some traders measure the height of the triangle pattern (from the high to the low) and add it to the breakout point in the direction of the trade to estimate a potential target level.
○ You can also draw a trendline that runs parallel to the trendline opposite the breakout that you can plot from the initial touchpoint of the triangle in the breakout direction.
● Think about Position Sizing
○ Ensure that your position size is consistent with the distance between your entry point and your stop loss. It should allow you to manage risk appropriately based on your risk appetite.
○ Position size should also be proportionate to the size of your trading account. A general rule is to risk no more than a certain percentage of your trading capital on a single trade (e.g., 1-2%).
○ Do not forget to also take into account the characteristics of the market you're trading.
● Take into Account Special Considerations
○ Adjust your stop-loss and take-profit levels according to market conditions and the volatility of the asset you are trading. In highly volatile markets, you may need to widen the stop-loss to avoid getting stopped out prematurely.
○ Keep in mind your account size and the position size relative to the stop-loss level. The size of your position should be such that a loss, if the stop-loss is hit, is within your risk tolerance.
○ The choice of time frame also impacts the placement of stop-loss and take-profit levels. On shorter time frames, levels should be closer to the entry point, whereas longer time frames may allow for more extended levels.
Trading Triangle: Practical Tips and Best Practices
Whether you are a novice trader looking to enhance your understanding of triangles or a seasoned trader seeking to refine your skills, these tips will provide you with valuable tools to navigate the world of trading with confidence using triangle patterns.
● Knowledge about Triangles and How to Trade Them
○ Familiarize yourself with the various types of triangle patterns and all the subtleties of symmetrical, ascending, and descending triangles.
○ Understand how each type may indicate different future price movements and how you can profit from it to maximise your chances of success and lower your overall risk.
● Strong Trend Endorsement and Reversal Patterns
○ Prioritize triangles that form during robust bullish or bearish trends, as they tend to result in more reliable and successful trades.
○ Recognize that these triangles often act either as continuation or reversal patterns, affirming the current trend's strength or changing it to the opposite direction.
● Pattern Depth
○ Analyze the depth of the triangle pattern.
○ A deeper and more extended pattern is often more reliable than a shallow one, as it suggests a more significant consolidation before the breakout.
● Angle and Trendline Analysis
○ Pay attention to the angles and slopes of the trendlines forming the triangles.
○ Analyze whether the trendlines provide strong support or resistance, as this can affect the breakout direction.
● Patience and Discipline
○ Exercise patience and discipline by waiting for a triangle pattern to fully develop before initiating a trade.
○ Rushing into trading a premature pattern can lead to unreliable outcomes and heavy losses if you're wrong about the breakout's direction, or if it is a false signal.
● Beware of False Breakouts
○ Acknowledge that false breakouts are common when trading triangles.
○ Implement strategies to filter out false signals, such as waiting for confirmation beyond the triangle's boundaries, spotting breakouts that align with key support and resistance levels, and waiting for multiple confirmations.
● Volume Confirmation
○ Consider the trading volume during the formation of the triangle pattern.
○ Higher trading activity can indicate increased market interest and may be a precursor to a strong breakout.
● Timeframe Selection
○ Utilize larger time frames to identify significant price levels and trending movements.
○ Longer time frames provide a broader perspective and help in determining the breakout's potential direction.
● Technical Analysis and Drawing Tools
○ Incorporate technical analysis and drawing tools to your triangle trading toolkit to confirm potential breakouts.
○ These tools can aid you in better identifying entry and exit points and assessing the strength of the pattern.
● Confirmation through Closure
○ Wait for prices to not only break out the triangle, but also close outside of it.
○ Confirm that the breakout has staying power by ensuring the price remains beyond the triangle's confines for at least a day.
● Economic Calendar Awareness
○ Stay informed about economic events that could influence market dynamics.
○ Calendar events like economic reports and news releases can have a significant impact on price movements and should be considered in your trading plan to be better prepared for higher volatility.
● Flexible Money Management
○ Once you've profited from a successful breakout, consider implementing dynamic money management techniques.
○ Tools like trailing stops can help you secure gains and protect your investment as the trade progresses.
● Demo Account
○ To improve your ability to identify, draw, and trade triangles, you might want to use a demo trading account.
○ You will then be able to practice triangle trading without fear of losing money, as you will be using virtual money.
The information provided does not constitute investment research. The material has not been prepared in accordance with the legal requirements designed to promote the independence of investment research and as such is to be considered to be a marketing communication.
All information has been prepared by ActivTrades (“AT”). The information does not contain a record of AT’s prices, or an offer of or solicitation for a transaction in any financial instrument. No representation or warranty is given as to the accuracy or completeness of this information.
Any material provided does not have regard to the specific investment objective and financial situation of any person who may receive it. Past performance is not a reliable indicator of future performance. AT provides an execution-only service. Consequently, any person acting on the information provided does so at their own risk.