One of the most important jobs a trader has to do is identify trading opportunities, something I frequently write about.
However, as well as picking out potential trades, the trader needs to be able to distinguish between “good and bad” ideas as well as those that have the most chance of success. That is where it gets complicated because, as a rule, we don't have a crystal ball or the ability to see into the future.
What we can often do, however, is make an educated or well-informed guess about what happens next.
Take this post and chart that I shared last week, when I said that:
“I am going to blow my own trumpet in this post why? Well just because.....
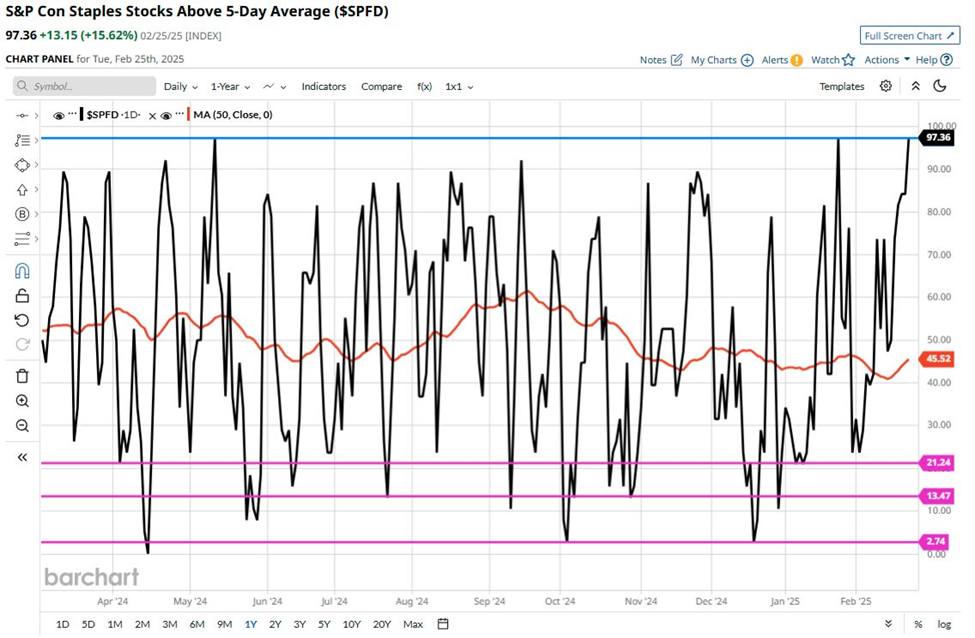
I shared this chart (which I now believe to have been my best post this week) on Discord at 14.25 yesterday afternoon (26-02-2025) saying that:
"I like select stocks in this sector (Consumer Staples), but has it run its course near term?"
At that point, the % of stocks in the sector trading above their 5-day Moving Average was north of 97.0%.
I added that:
“This morning it's down at 31.57% (that's a -67.57% change intraday). Oh, and the S&P 500 Consumer Staples sector index fell by -1.86% on the session in case you were wondering and was the worst performer among the 11 S&P sectors.”
Source: Barchart.com
This was an opportunistic or tactical trade idea, that highlighted an overbought situation in the Consumer Staples sector, or more specifically an overbought situation in a short-term momentum indicator on the sector.
What it did was highlight the path of least resistance for the 5-Day MA% indicator in the Consumer Staples, which at 97.0% was overbought, and would likely find it far earlier to fall from there than continue to rally.
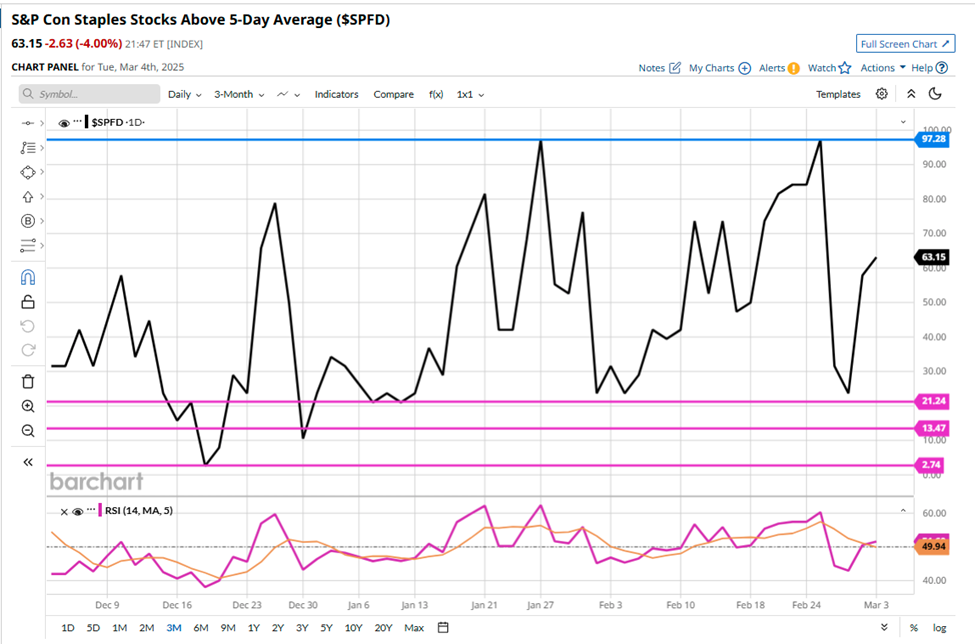
If you did want confirmation before acting on this, then of course you could have used an additional indicator such as RSI 14 and in this case RSI 14 with its own 5D MA line.
Which you can see in the bottom window on the chart below.
What we see is that the RSI falls away, and crosses below its 5 D MA line, at the same time as the MA% line, in the upper window, plunged sharply lower.
Source: Barchart.com
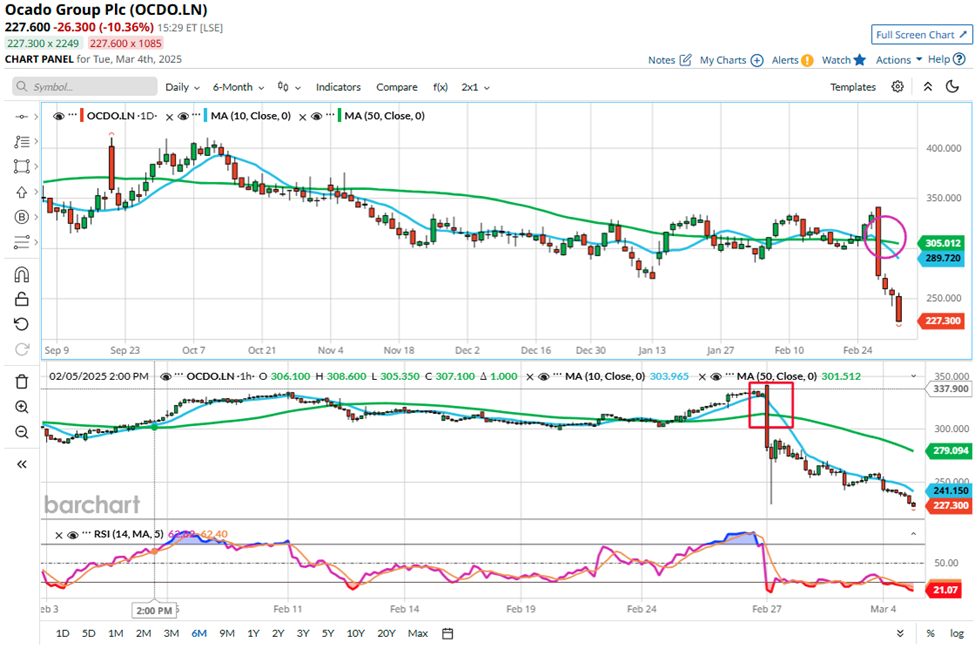
Identifying and following the path of least resistance is certainly a skill worth mastering, and coincidentally we have another prime example of it here, also in a consumer-facing stock in this instance, London-listed, Ocado, an online grocery delivery and logistics business.
Source: Barchart.com
Here we see two charts over different time frames, the upper chart is a 6-month candle chart, the lower chart is drawn over a 1-month timescale. Both charts contain bearish MA Crossovers, and I have also included RSI 14 in the short-term chart which once again heads lower and breaks below its own 5-Day MA line.
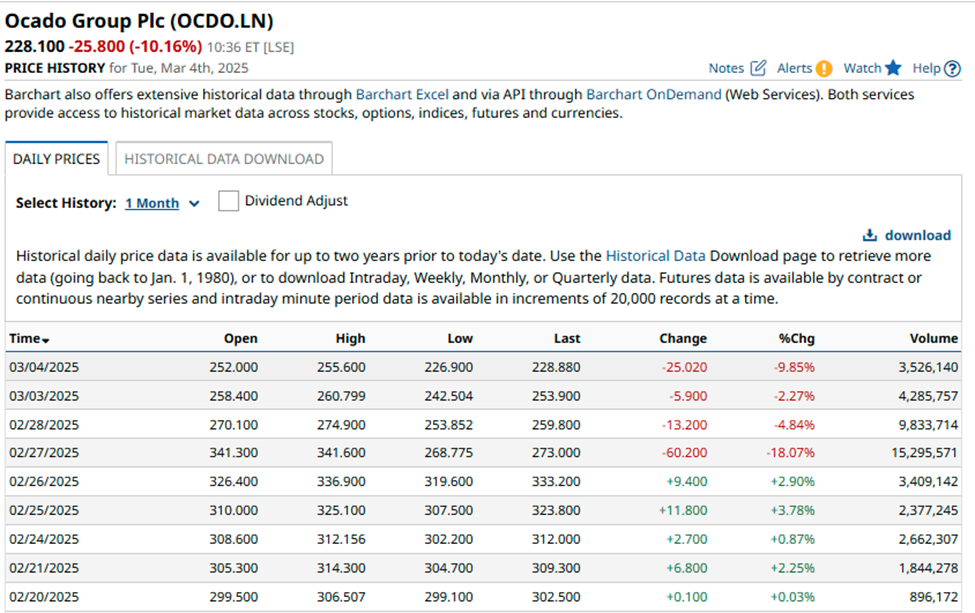
Ocado has lost -29.52% of its value over the last week as of the time of writing, as we can see those losses were accompanied by higher volumes than we had recently seen in the stock.
Source: Barchart.com
Once again, the path of least resistance here seemed obvious.
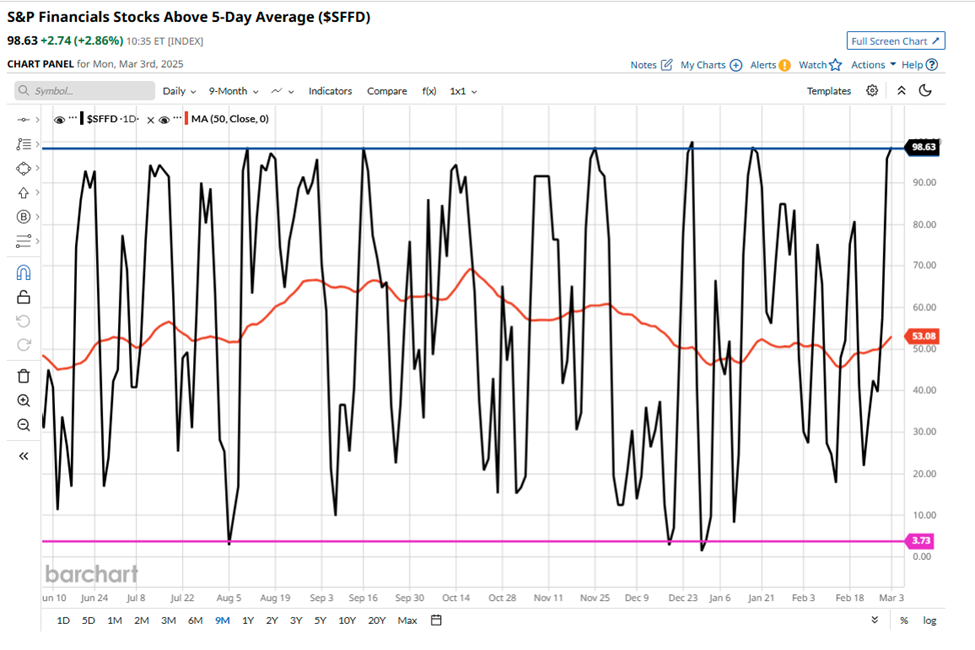
Sometimes the story writes itself, for instance, I posted this chart on Discord on Monday, March 3rd, saying that:
"On a different note (I) think US Financials are short term overbought"
Monday March 3rd
Source: Barchart.com
What happened to the 5D MA % indicator on Tuesday, March 4th? Well frankly it collapsed.
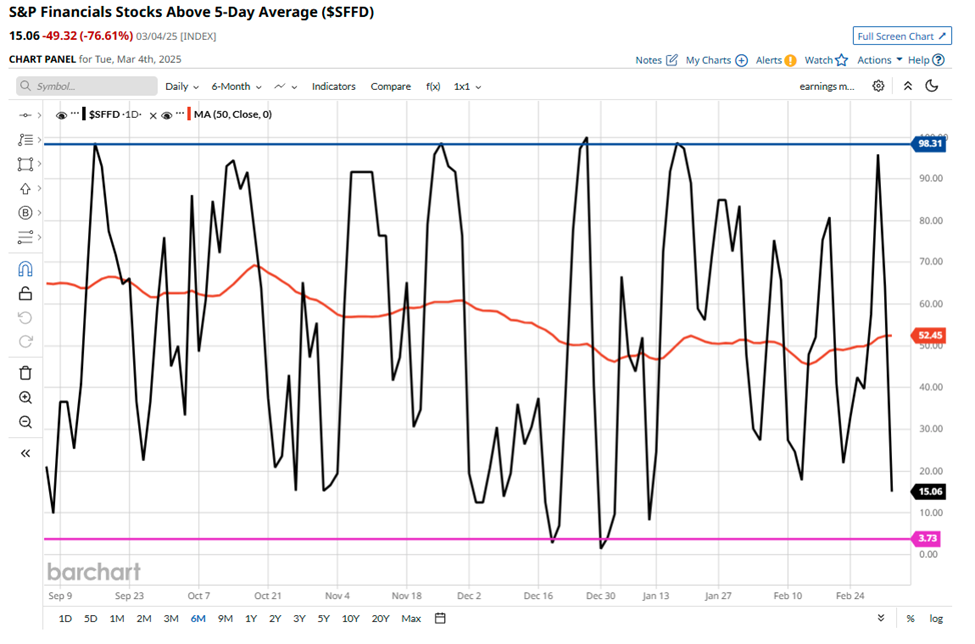
Source: Barchart.com
What happened to the S&P 500 Financials Sector on Tuesday, March 4th? Well, it sold off hard.
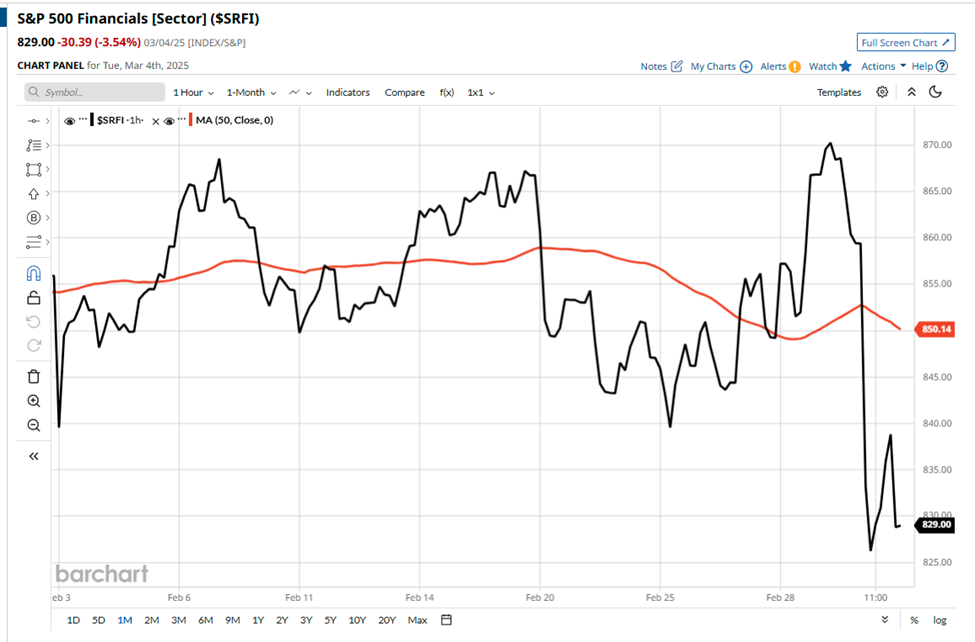
Source: Barchart.com
In fact, this was the third biggest fall, in the S&P 500 Financials sector index, over the last two years.
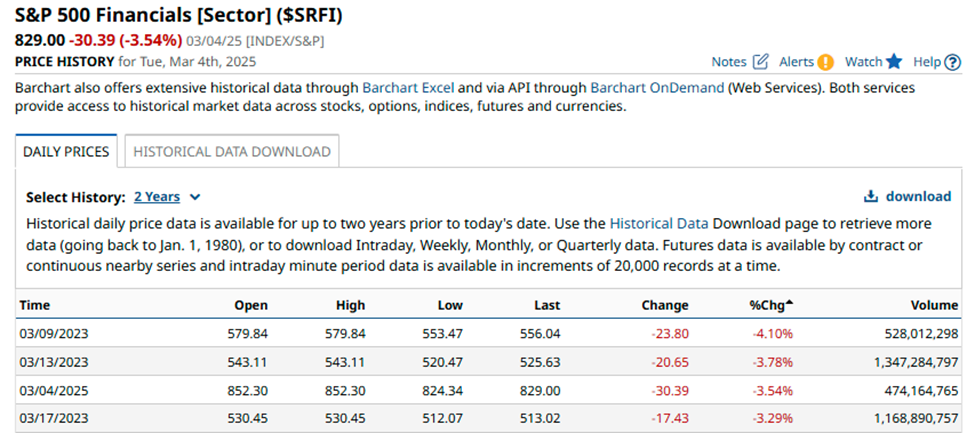
Source: Barchart.com
Of course, it won't always be that straightforward to find trading opportunities that highlight and follow the path of least resistance in the price action, but when you do find them, they can be rewarding in every sense.
The information provided does not constitute investment research. The material has not been prepared in accordance with the legal requirements designed to promote the independence of investment research and as such is to be considered to be a marketing communication.
All information has been prepared by ActivTrades (“AT”). The information does not contain a record of AT’s prices, or an offer of or solicitation for a transaction in any financial instrument. No representation or warranty is given as to the accuracy or completeness of this information.
Any material provided does not have regard to the specific investment objective and financial situation of any person who may receive it. Past performance is not a reliable indicator of future performance. AT provides an execution-only service. Consequently, any person acting on the information provided does so at their own risk.