
As an investor or a trader, you are likely to be interested in which way the stock market is heading next However trying to figure that out is much harder than it sounds.
That’s because the stock market is influenced by many factors, such as economic data, corporate earnings, geopolitical events, and investor sentiment.
The good news is that there are some indicators that can help you gauge the overall direction and strength of the market.
Here are five of them:
The S&P 500 Index.
The S&P 500 is a broad-based index that tracks the performance of 500 large-cap U.S. companies. It is widely considered as the benchmark for the U.S. and global stock markets. The index accounts for the majority of US market capitalisation and by extension, for a large portion of the total global market cap.
The S&P 500 reflects the collective expectations and actions of millions of investors and traders, so its trends and levels can indicate the general mood and direction of the wider market (s)
What happens to S&P 500 is often reflected in the performance of other stock markets other
The chart below plots the performance of the S&P 500 index with the S&P Global 1200 index.
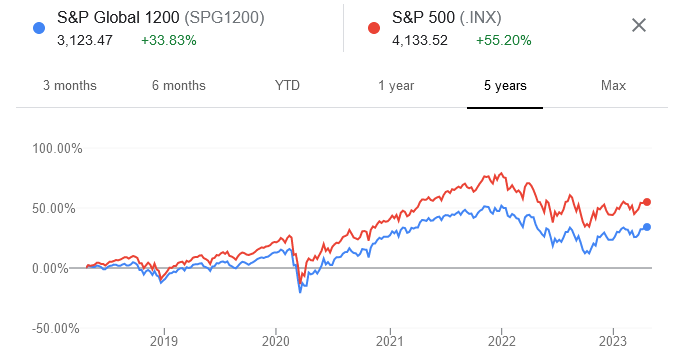
Source: Google Finance
Looking beyond headline movements in stock indices we can examine the performance of individual stocks to try and get a handle on where stock markets, and the sentiment that surrounds them, are heading.
However, there are many thousands of stocks listed on major exchanges and looking at their performance individually isn’t a practical proposition, and probably wouldn’t be that informative, even if it were.
But if we could look at those individual stocks in aggregate or combination, then we could glean some useful data.
Advance-Decline Line
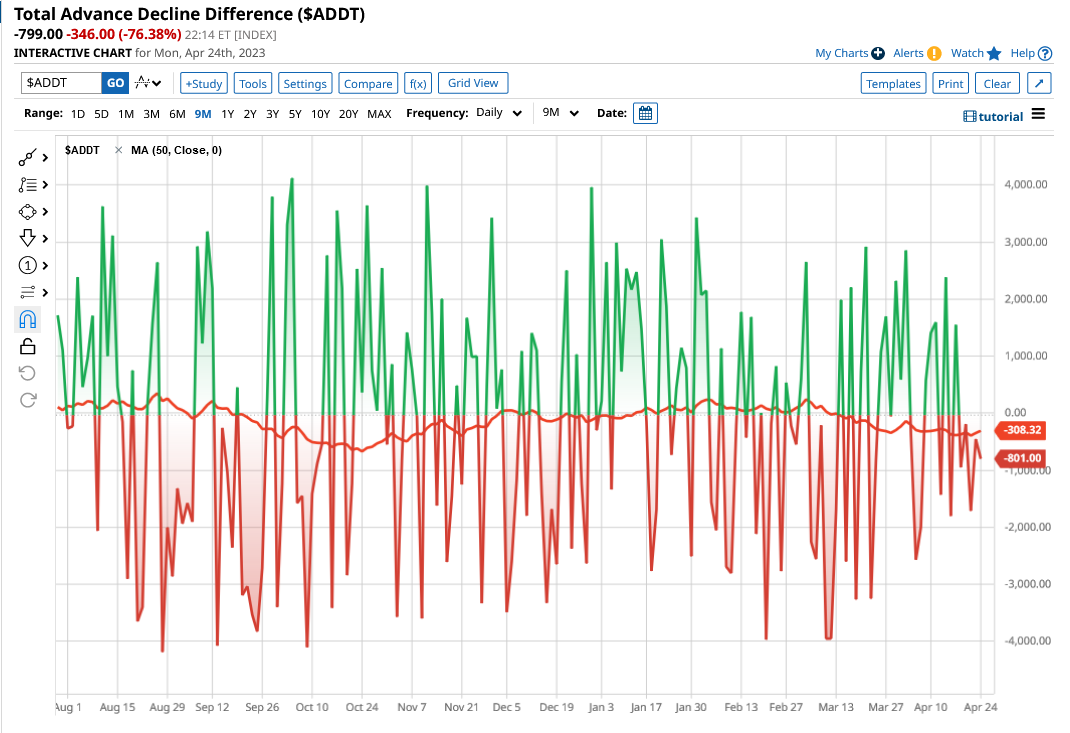
The advance-decline line (ADL) is a technical indicator that measures the number of stocks that are rising versus the number of stocks that are falling on a given day.
It is calculated by subtracting the number of declining stocks from the number of advancing stocks and adding the result to a cumulative total. The ADL shows the breadth and participation of the market.
A rising ADL means that more stocks are participating in the uptrend, which is a bullish sign. Whilst a falling ADL means that more stocks are lagging behind or declining, which is a bearish sign.
You can plot the ADL on a chart such as the one below from barchart.com which shows the ADL for all US equities over the last nine months.
Alternatively, you can look at a representation of the data such as this one from barchart.com. This shows us the advancing and declining volume traded on the NYSE, Nasdaq and ARCA exchanges. As well as the number of stocks on those exchanges making new highs and lows, over a variety of time frames.
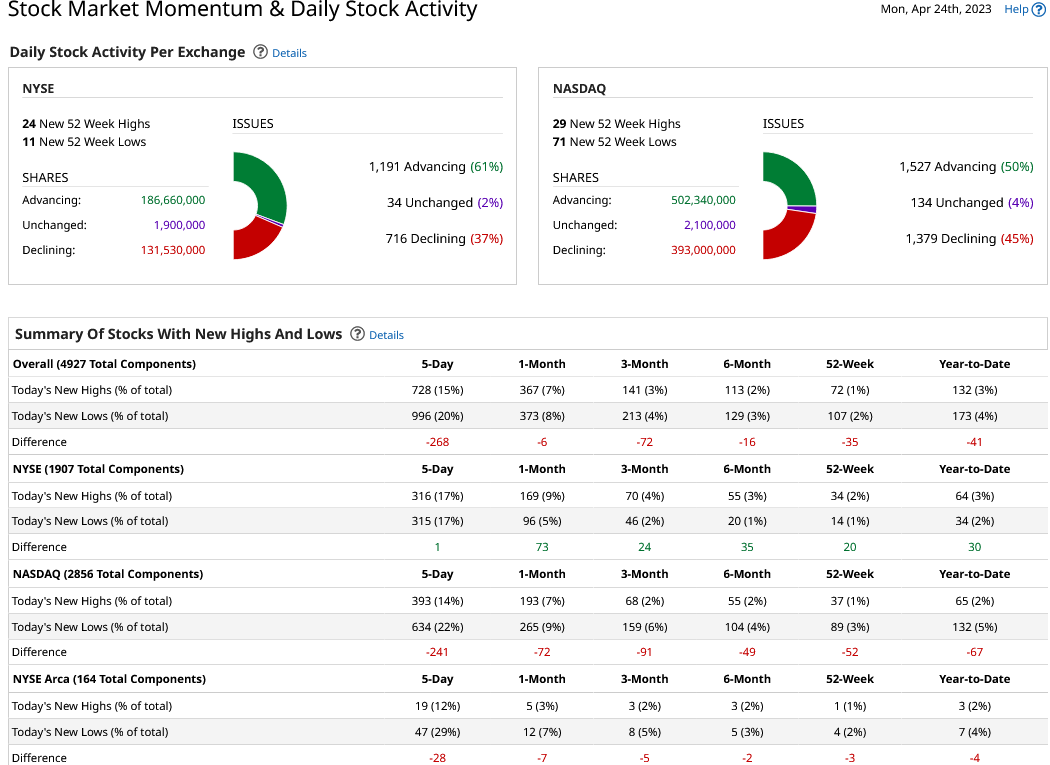
https://www.barchart.com/stocks/momentum
The VIX index
The volatility index or VIX is a measure of the expected volatility or risk in the stock market over the next 30 days. It is derived from the prices and implied volatilities present in options on the stocks within the S&P 500 index.
The VIX is often referred to as the "fear index" because it tends to rise when investors are fearful or uncertain about the future and fall when investors are confident or complacent.
The VIX can indicate the level of risk appetite and sentiment in the market - in effect, it's a risk-on/risk-off indicator.
Or is it?
I say that because of late the VIX has not been behaving as we might have expected it to.
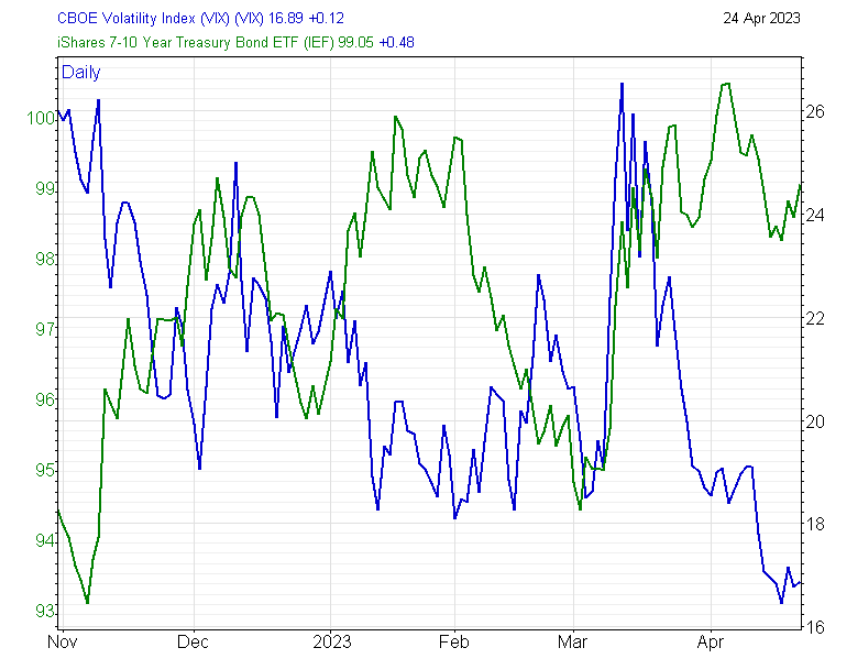
In an uncertain or risk-averse environment, the VIX should (in theory) rise, and follow the price performance of risk-off assets such as US govt bonds.
However, if we look at the chart below which plots the VIX against the iShares 7-10 year Treasury Bond ETF (IEF) over the last 6 months we find the reverse is true.
Quite why the VIX has been trending lower despite fears about overvalued equity indices, inflation, interest rate rises and a possible US recession is unclear and yet it has.
Moving Averages
Moving averages (MAs) are simple mathematical tools that smooth out the price fluctuations of a stock or an index over a period of time.
They show the average price performance of a security over a specified period, such as 50 days or 200 days.
MAs can act as support or resistance levels for the price, and they can also signal trend changes and momentum shifts.
For example, when a price crosses above its 50-day MA, it can indicate an uptrend or a bullish momentum. Or when a price crosses below the 50-day MA, it could indicate a downtrend or a bearish momentum.
We can also look at the relationship between two different MA lines to determine where the market may move next. For example, this chart which plots the S&P 500 Information Technology sector against its 20 and 50-day MA lines .
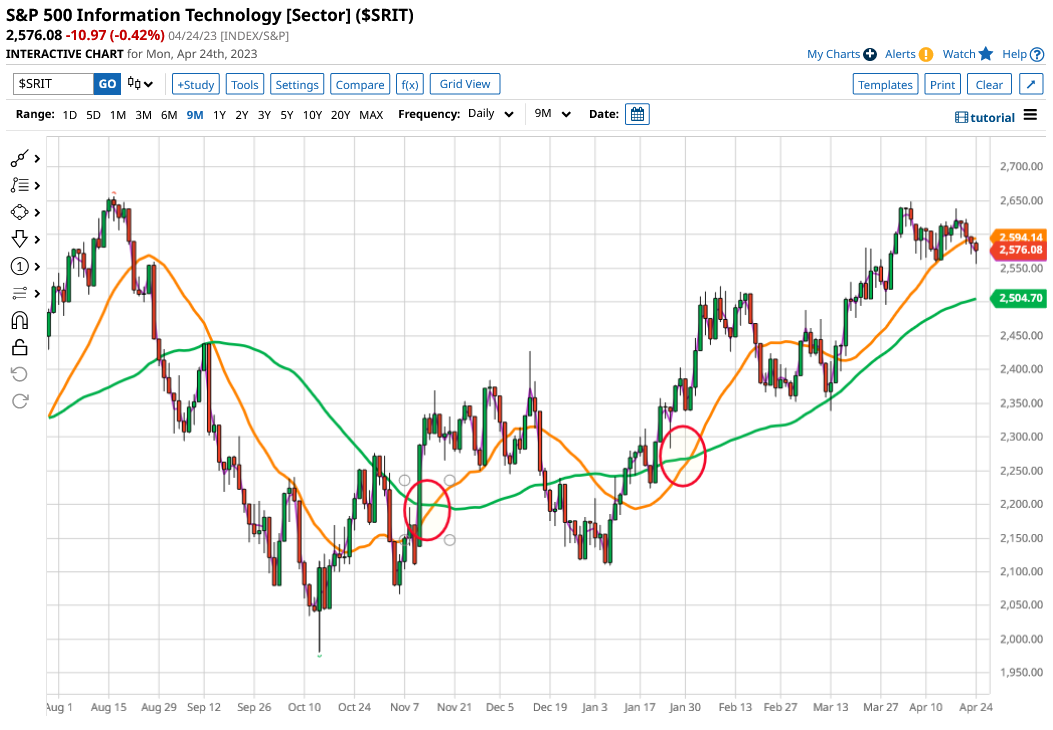
I have highlighted two occasions when the faster-moving 20-day line in orange, crosses up through the slower-moving 50-day line drawn in green. In both instances, the Information Technology index moved higher after the “golden cross” was posted.
Relative Strength Index
The relative strength index (RSI) is a momentum indicator that compares the magnitude of recent gains and losses of a stock or an index over a period of time, usually 14 days. It ranges from 0 to 100, with readings of 70 and above indicating overbought conditions and 30 and below indicating oversold conditions.
The RSI can show the strength and weakness of a security relative to itself and the market.
For example, when the RSI is above 70, it can suggest that the security is overbought and due for a correction or a reversal.
When the RSI is below 30, it can suggest that the security is oversold and due for a bounce or a recovery.
None of these indicators is infallible, individually they may not provide a trader with the full picture of what’s happening in the market.
However, when used in combination, they provide a good overview of the market and the sentiment within it.
And that can take you a long way when you are trying to figure out what the market's next direction will be.
The information provided does not constitute investment research. The material has not been prepared in accordance with the legal requirements designed to promote the independence of investment research and as such is to be considered to be a marketing communication.
All information has been prepared by ActivTrades (“AT”). The information does not contain a record of AT’s prices, or an offer of or solicitation for a transaction in any financial instrument. No representation or warranty is given as to the accuracy or completeness of this information.
Any material provided does not have regard to the specific investment objective and financial situation of any person who may receive it. Past performance is not a reliable indicator of future performance. AT provides an execution-only service. Consequently, any person acting on the information provided does so at their own risk.