
The first quarter of 2024 is coming to an end, and the long holiday weekend provides us with the chance to reflect on how the markets have performed in that time frame.
As far as stocks are concerned the focus has largely been on the US once again, however, there have been several points of interest elsewhere.
The S&P 500
S&P 500 Sector Performance YTD (25-03-2024)
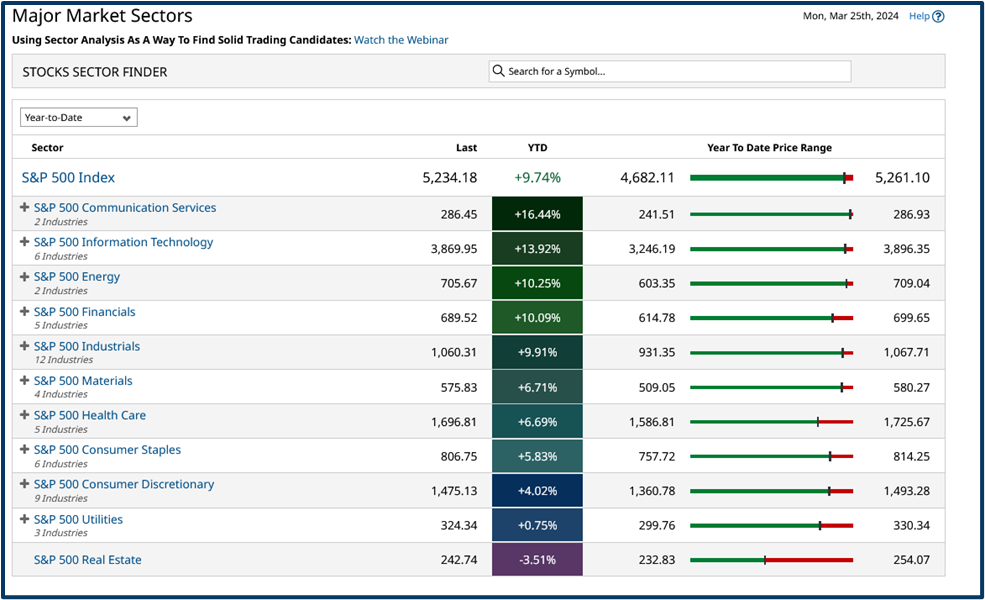
Source: Barchart.com
Despite a wobble or two, US tech-related sectors have been the main drivers of the market.
With both Information Technology and Communications Services looking likely to finish Q1 towards the top end of their ranges posting impressive double-digit year-to-date percentage gains.
The Energy sector has also come back into vogue, adding +10.25% as of the time of writing.
That, despite US natural gas prices falling by -34.00%, thanks to a mild winter and increasing supplies.
Against that Brent crude has risen by +10.85% this year.
Material World
The Materials sector, which includes miners, steel producers and speciality chemicals stocks, has also been in demand.
What's interesting here is that these are largely cyclical stocks, which typically do well at the start of the economic cycle, rather than when the cycle matures.
Is the demand for stocks in this sector, telling us that we have skipped the downturn expected after the post Covid boom? And that instead we have “advanced directly to go” once more?
Copper miner Freeport McMoran FCX US is a good example of the recent uplift in Material’s stocks.
Note the MA crossover in the chart below, as the faster-moving 10-day line moves up through the slower moving 50 day line. FCX US is up by +16.0% in the last month.
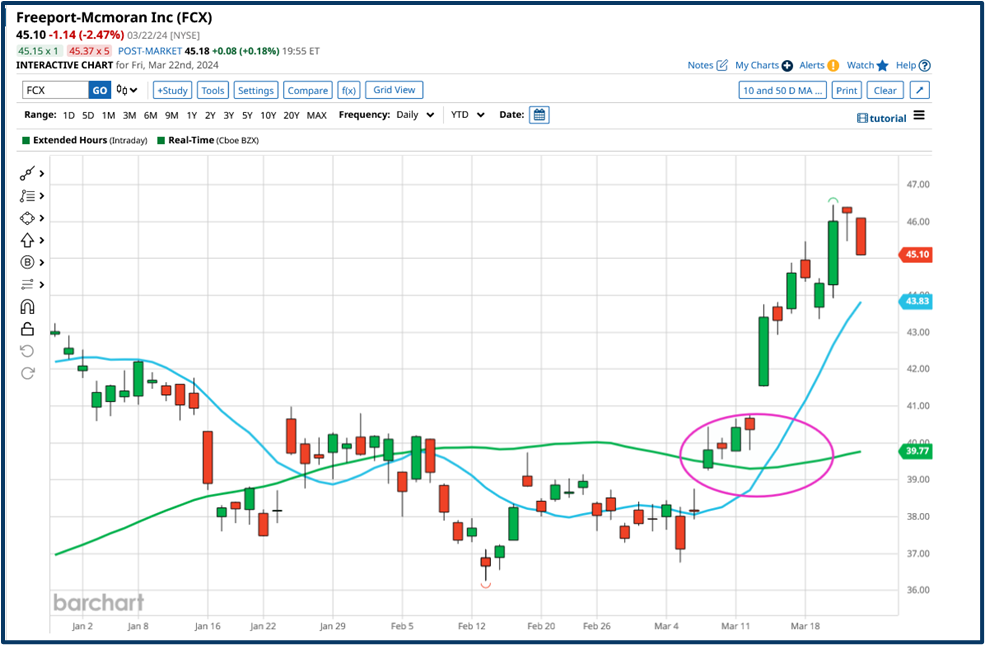
Source: Barchart.com
We can see a similar pattern and signal in Eastman Chemical EMN US which previously broke out to the upside, in October last year.
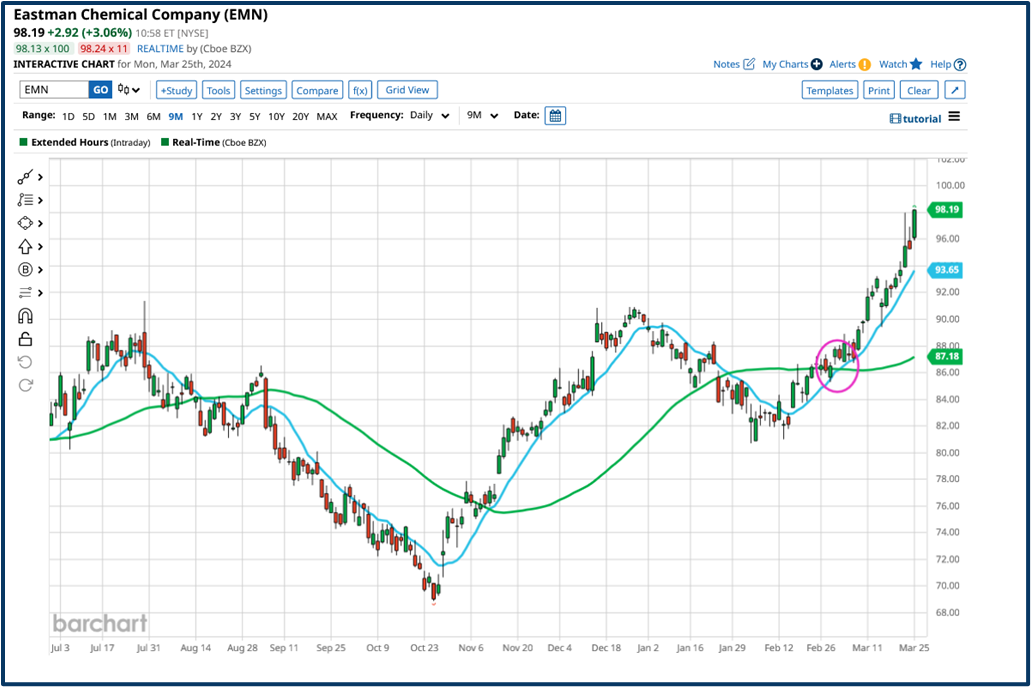
Source: Barchart.com
New all-time highs
US equities haven't been the only game in town, however.
Japan’s Nikkei 225 index has made new all-time highs, finally surpassing the peak seen at the end of the 1980s.
Recent gains in the Japan 225 index can be attributed to the weak yen. A weaker currency benefits the exporters that make up much of the Nikkei.
Japanese equities are among the top-performing assets year to date, in US dollar terms, having returned +9.30%, according to data from Bank of America.
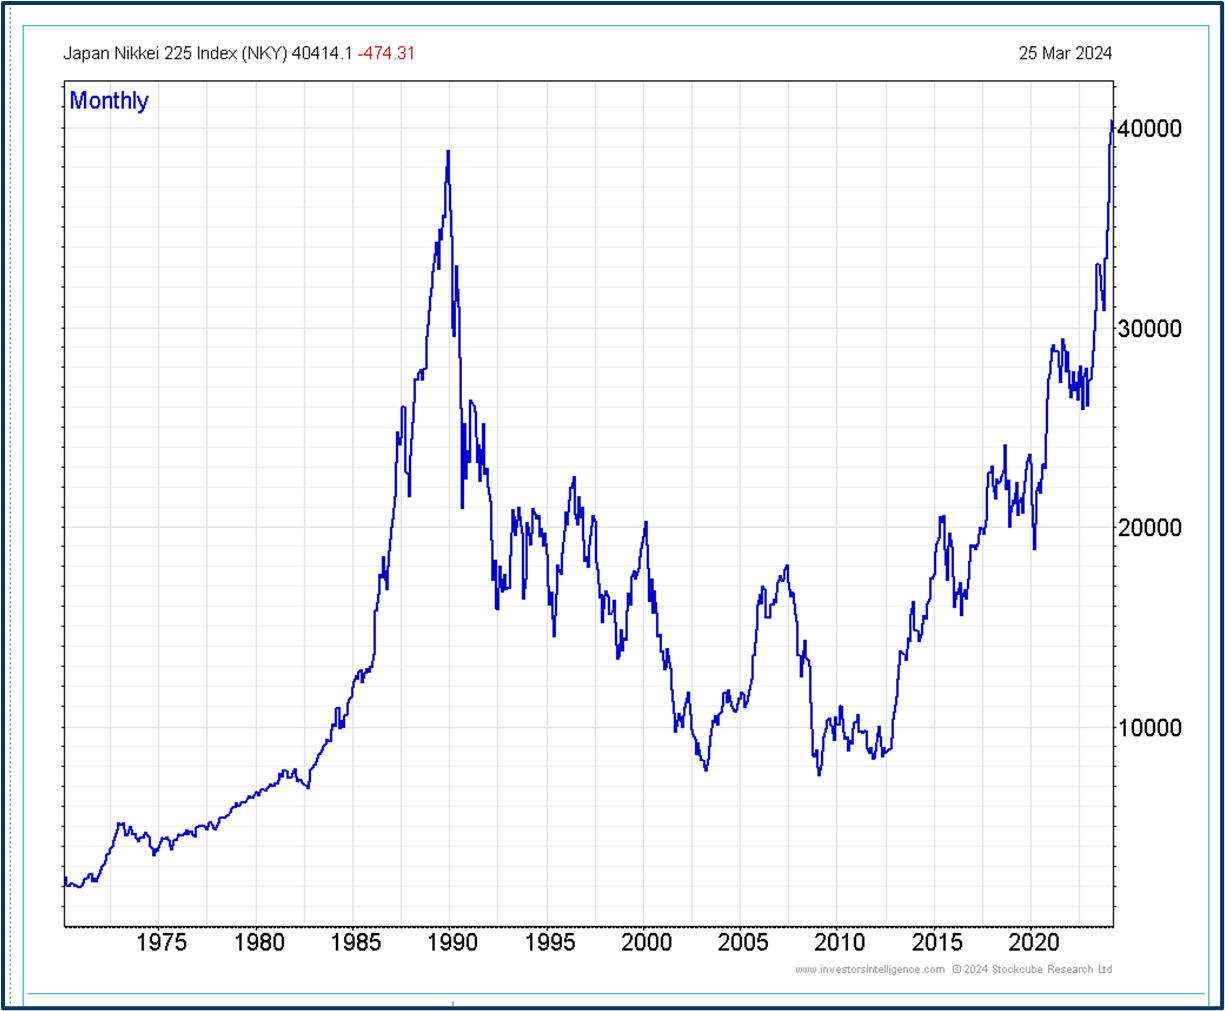
Source: Investors Intelligence
However, with the Bank of Japan now moving away from negative interest rates, the question must be will the yen strengthen on expectations of further rate rises?
And if it does, will that undermine Japanese equity gains?
That said Japanese equities as a whole don’t look expensive right now.
The broad-based Topix Index (which is made up of 2000 stocks) trades on a forward PE of just 16.33 times.
That compares favourably to the US Russell 2000 index which is on a forward PE ratio of 27.49 times currently.
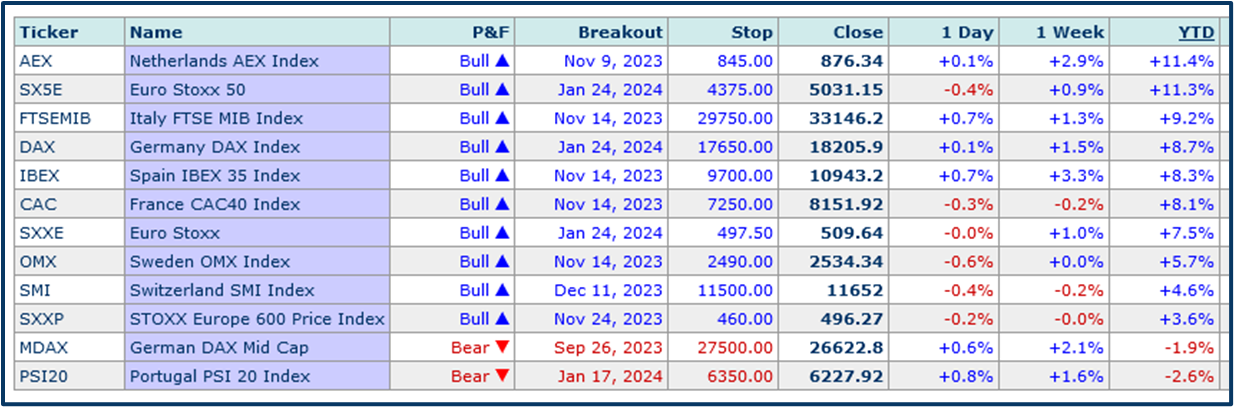
Europe has been travelling well
European stocks have also been on the front foot during Q1, the Dutch AEX has added +11.40% and the Euro Stoxx 50 +11.30%.
Much of the gain seen in the Netherlands can be attributed to ASML Holdings, the company makes the high-end silicon chip, manufacturing machines, that are in so much demand right now.
ASML shares have risen by almost +33.0% this year, and with AI continuing to be the dominant narrative, it’s quite possible that they could see further gains.
However, we also need to be mindful of the fact that ASML operates out of a single location in the Netherlands, within its own niche supply chain. So it is questionable how much spare capacity the company has.
And let’s not forget that the lithography machines, that ASML makes, are delivered in 250 separate shipping containers and take six months to be assembled on-site.
The Eurostoxx 50 index has benefited from ASML’s impressive gains but has also been a beneficiary of the positive returns seen in French and German stocks. Which between them account for almost 69.0% of the index. See below.
It's also interesting to note that despite the perception that Technology only resides in the US, the tech sector is the largest component in the Euro Stoxx 50.
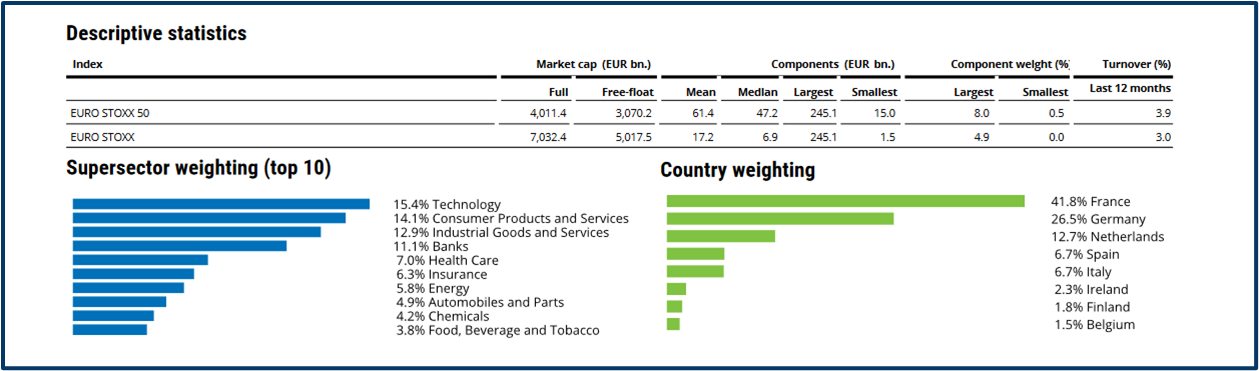
Source: STOXX Limited
The UK could do better
The UK has been a laggard when compared to other major markets though it has sprung to life over the last week during which time it’s added 2.50%
When it comes to UK equities we have to dig below the surface and when we do we find items of interest
For example, here is a chart of the percentage change in Rolls Royce RR. LN versus that in Nvidia NVDA US over the last two years. Unlikely as it might seem Rolls Royce has outperformed the AI front-runner.
Rolls Royce hasn’t been able to match Nvidia’s gains in 2024 of +92.0%. Though they have managed to add an impressive +42.0%. I also note that more than 20, FTSE 100 stocks, are up by +10.00% or more this year.
Rolls Royce Versus Nvidia
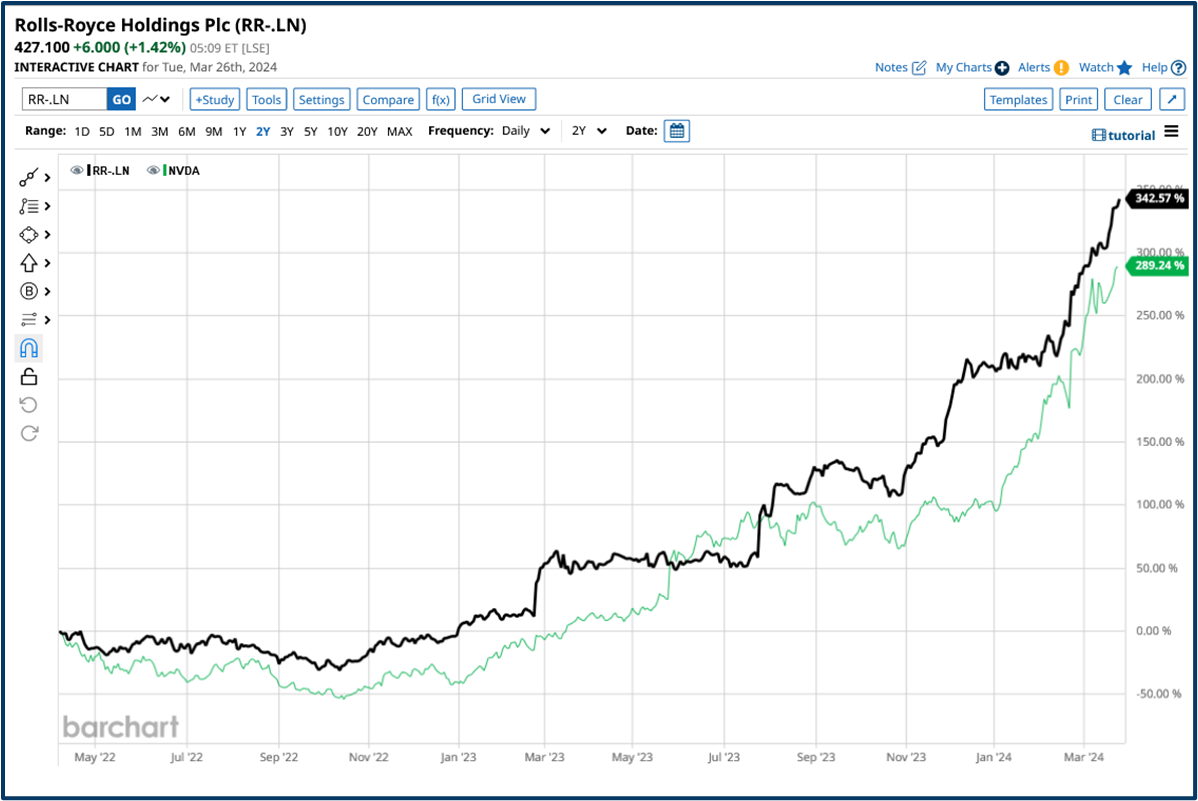
Source: Barchart.com
China and Hong Kong
Finally, let’s spare a thought for markets that have been left behind.
Hong Kong’s Hang Seng is down -2.50% year to date (at the time of writing) and the Shanghai Composite index, in China proper has added just +1.90% year to date. China’s economy failed to launch after it exited its extended COVID-19 lockdown and remains sluggish at best.
The table below, which is drawn, from the Bank of America Flow Show report provides a nice overview of how asset classes, equity markets and sectors have performed during 2024 and we can see the leaders and laggards among them.
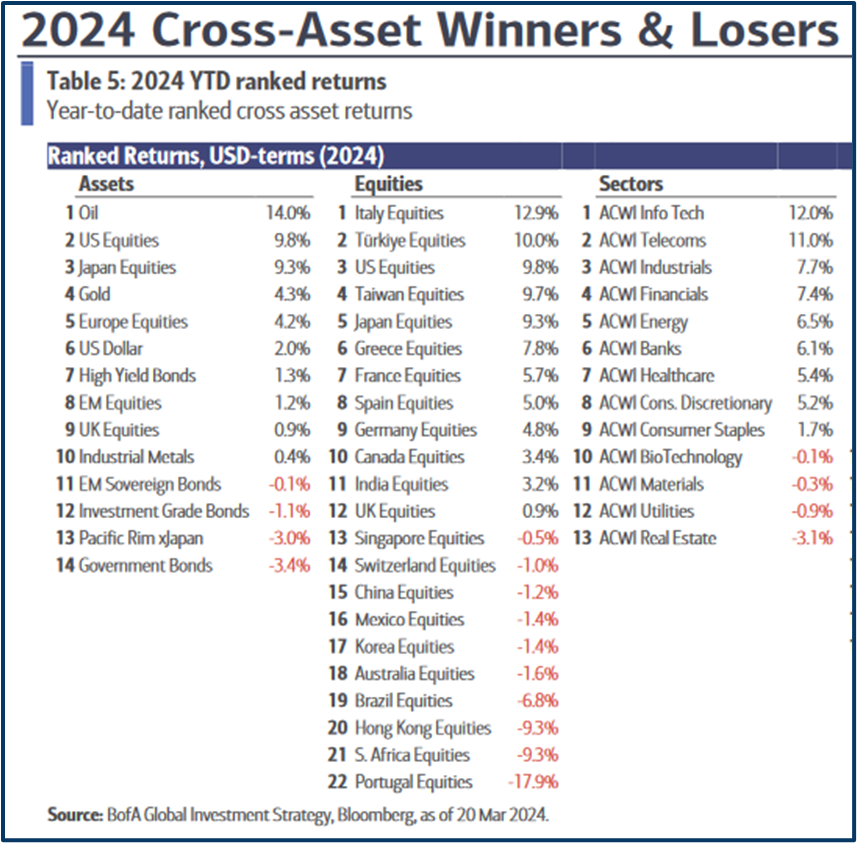
Source: Bank of America Flow Show report ACWI = All Country World Index
The information provided does not constitute investment research. The material has not been prepared in accordance with the legal requirements designed to promote the independence of investment research and as such is to be considered to be a marketing communication.
All information has been prepared by ActivTrades (“AT”). The information does not contain a record of AT’s prices, or an offer of or solicitation for a transaction in any financial instrument. No representation or warranty is given as to the accuracy or completeness of this information.
Any material provided does not have regard to the specific investment objective and financial situation of any person who may receive it. Past performance is not a reliable indicator of future performance. AT provides an execution-only service. Consequently, any person acting on the information provided does so at their own risk.